Fig. 18
Download original image
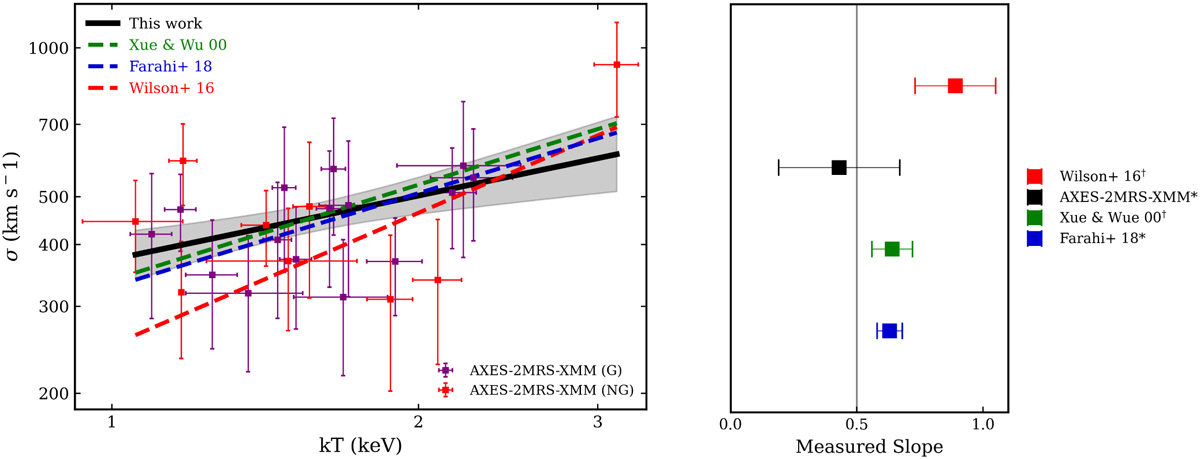
Velocity dispersion versus X-ray temperature. Left panel: velocity dispersion versus temperature for the XMM-Newton subsample used in this work in comparison with the literature. The G and NG groups in our AXES-2MRS-XMM sample are represented by purple and red squares, respectively. The grey transparent band is 1σ confidence interval for the slope and intercept. Right panel: comparison of the slope of the σv–kT relation with the literature. The grey solid line is the theoretical self-similar expectation. The asterisk mark (*) refers to works using Bayesian linear regression, while the dagger mark (†) refers to works using ODR. The slope of Wilson et al. (2016) is subject to a potential bias, as claimed in Farahi et al. (2018).
Current usage metrics show cumulative count of Article Views (full-text article views including HTML views, PDF and ePub downloads, according to the available data) and Abstracts Views on Vision4Press platform.
Data correspond to usage on the plateform after 2015. The current usage metrics is available 48-96 hours after online publication and is updated daily on week days.
Initial download of the metrics may take a while.