Fig. 16
Download original image
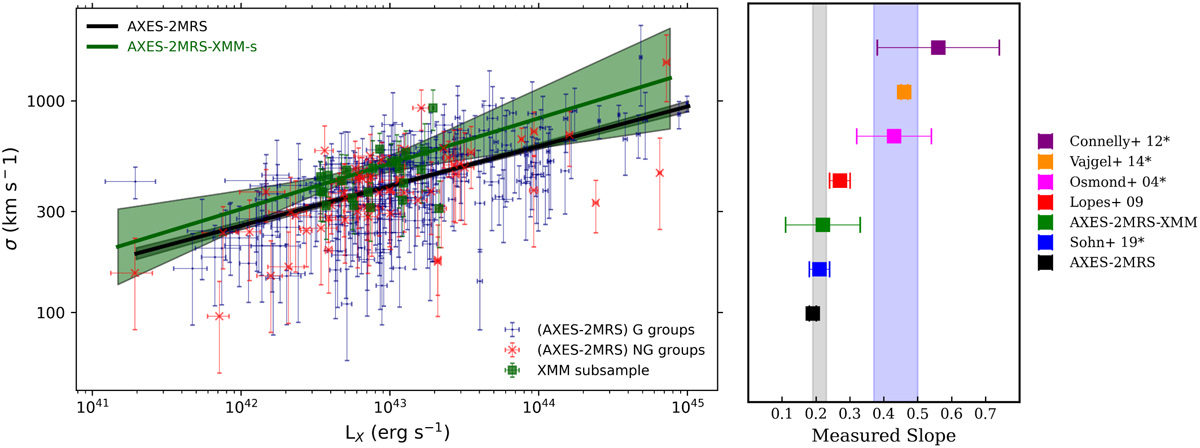
Velocity dispersion versus X-ray luminosity. Left panel: velocity dispersion versus X-ray luminosity for the full AXES-2MRS systems with at least five members and our XMM-Newton subsample. The G and NG groups are marked with blue circles and red crosses, respectively. The XMM-Newton subsample is marked with filled green squares. Shaded regions are 1σ uncertainties. Right panel: slope comparison for the σv–LX relation with the literature. The grey-shaded region is the self-similar expectation calibrated according to the X-ray emissivity in the band-limited range of 0.1-2.4 keV for groups with temperatures in the 0.7-3.0 keV interval, while the blue-shaded region is for the bolometric luminosity. (* refers to relations originally expressed as LX–σv and was inverted for comparability).
Current usage metrics show cumulative count of Article Views (full-text article views including HTML views, PDF and ePub downloads, according to the available data) and Abstracts Views on Vision4Press platform.
Data correspond to usage on the plateform after 2015. The current usage metrics is available 48-96 hours after online publication and is updated daily on week days.
Initial download of the metrics may take a while.