Open Access
Fig. 7.
Download original image
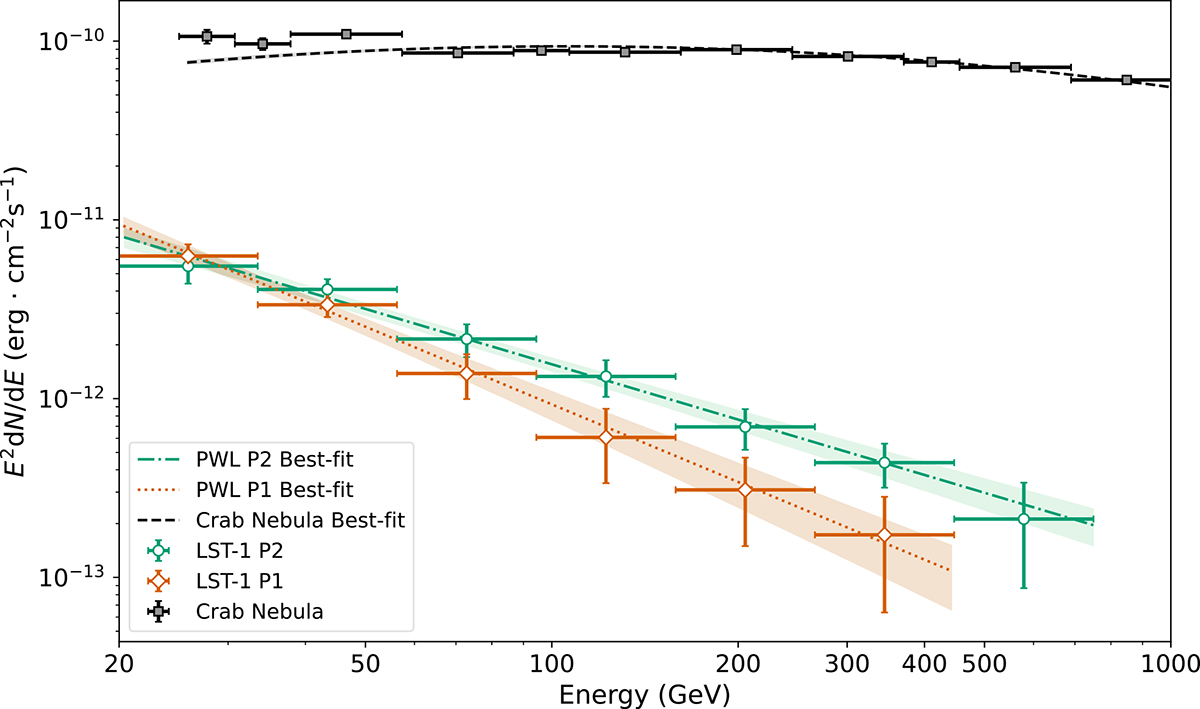
LST-1 SED of P1 and P2 of the Crab pulsar from 20 GeV to 700 GeV. The Crab Nebula spectrum obtained with the same sample is represented in black.
Current usage metrics show cumulative count of Article Views (full-text article views including HTML views, PDF and ePub downloads, according to the available data) and Abstracts Views on Vision4Press platform.
Data correspond to usage on the plateform after 2015. The current usage metrics is available 48-96 hours after online publication and is updated daily on week days.
Initial download of the metrics may take a while.