Fig. 6.
Download original image
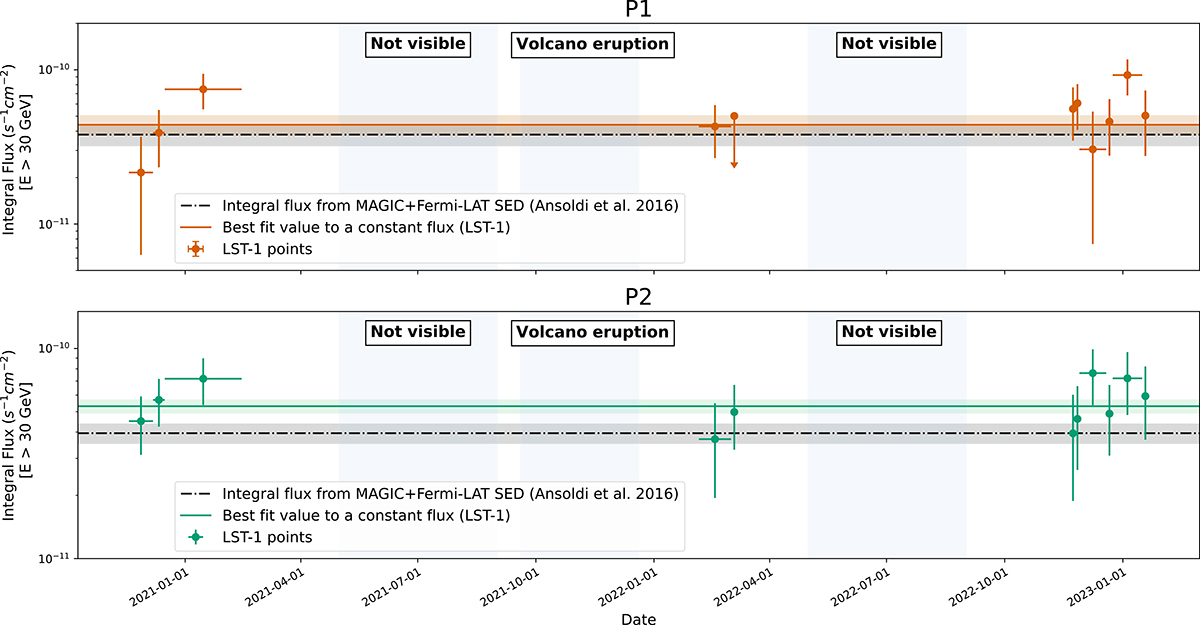
Long-term light curve of P1 and P2 Crab emission above 30 GeV. Each variable time bin contains 1500 excess events in the combined phase regions P1 and P2. This value was chosen to reach at least ∼3σ for the entire pulsed emission (P1+P2) in each bin. The horizontal bars indicate the time range of each bin. The flux was fit to a constant function, shown by the green line. The dashed green area represents the statistical uncertainties of the fitted flux. The reference integrated flux above 30 GeV using the MAGIC+Fermi/LAT SED reported in Ansoldi et al. (2016) is included in gray. The regions where the Crab pulsar was not observable are shown in blue, namely two summer periods and the volcano eruption that took place from September to December 2021 in La Palma.
Current usage metrics show cumulative count of Article Views (full-text article views including HTML views, PDF and ePub downloads, according to the available data) and Abstracts Views on Vision4Press platform.
Data correspond to usage on the plateform after 2015. The current usage metrics is available 48-96 hours after online publication and is updated daily on week days.
Initial download of the metrics may take a while.