Open Access
Fig. 3.
Download original image
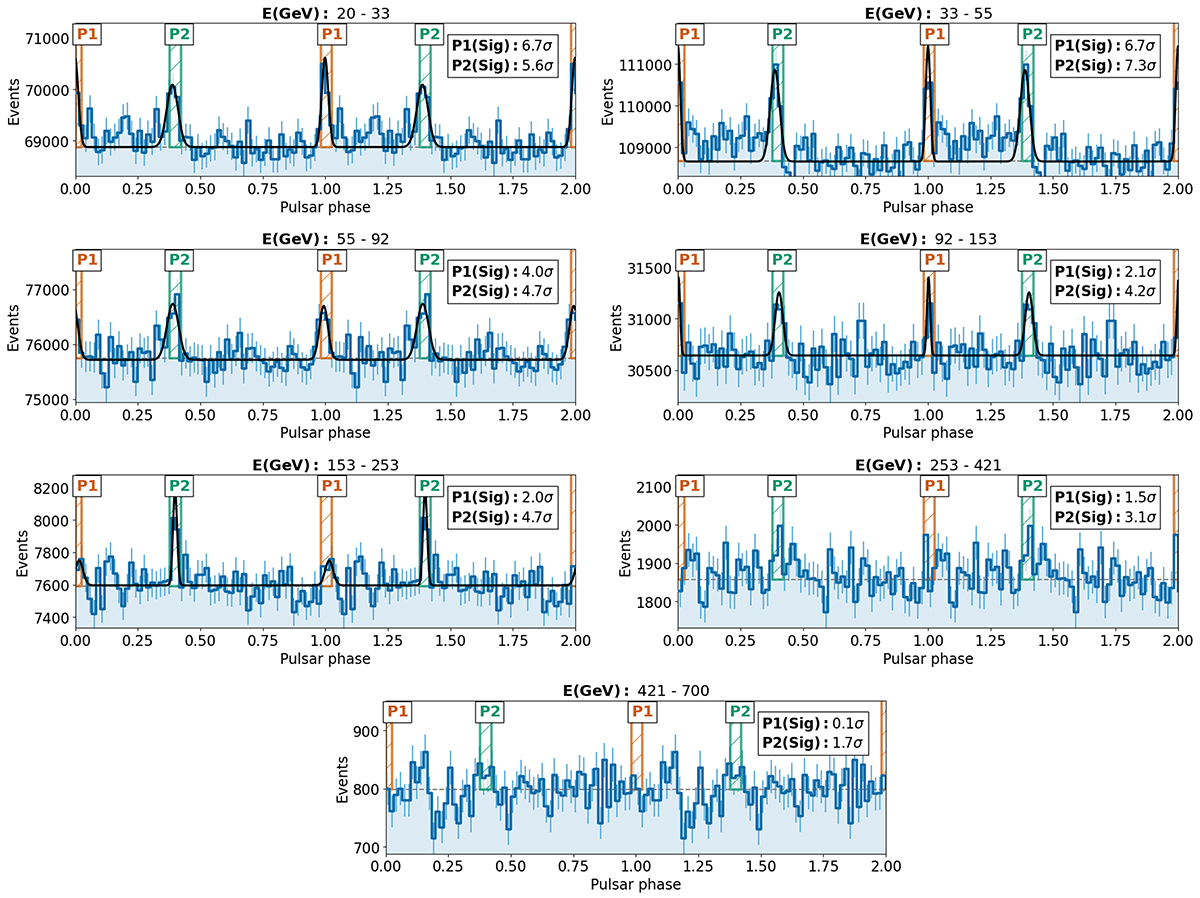
Phaseogram of the Crab pulsar from LST-1 data in different energy bins from 20 GeV to 700 GeV. The statistical significance of each peak is given in each plot. The black line shows the best fits to the pulse profile. Above 250 GeV the fit was not successful since the signal of P1 begins to disappear.
Current usage metrics show cumulative count of Article Views (full-text article views including HTML views, PDF and ePub downloads, according to the available data) and Abstracts Views on Vision4Press platform.
Data correspond to usage on the plateform after 2015. The current usage metrics is available 48-96 hours after online publication and is updated daily on week days.
Initial download of the metrics may take a while.