Fig. 1.
Download original image
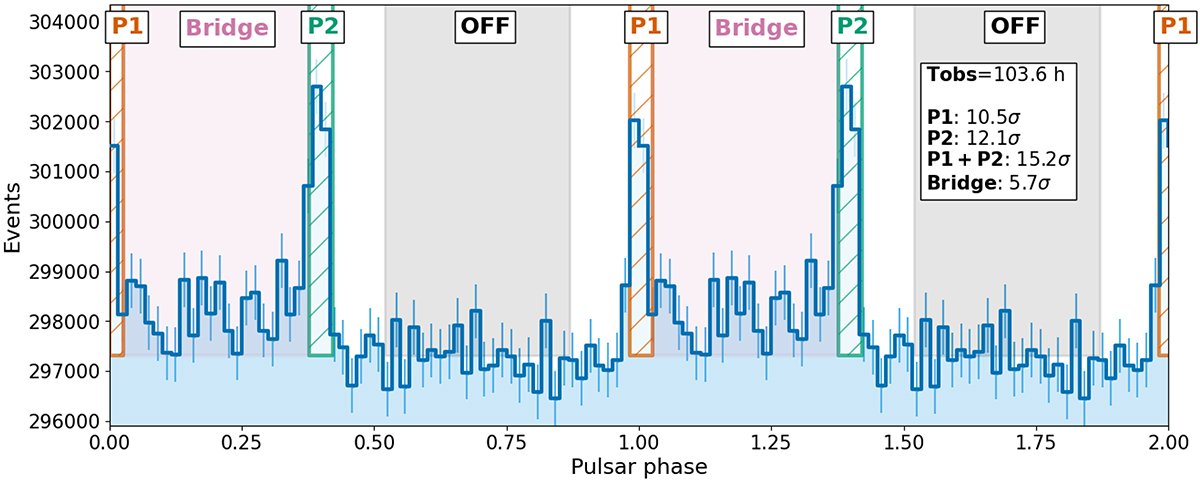
Phaseogram of the Crab pulsar sample from LST-1 data (Zd < 50 deg). Both peaks and the overall bridge emission between peaks are detected significantly. Most of the pulsed signal is provided by data at Zd < 25 degrees, so the energy threshold of the sample is Eth ∼ 20 GeV. The period corresponding to two rotations is shown in the phaseogram for better visualization.
Current usage metrics show cumulative count of Article Views (full-text article views including HTML views, PDF and ePub downloads, according to the available data) and Abstracts Views on Vision4Press platform.
Data correspond to usage on the plateform after 2015. The current usage metrics is available 48-96 hours after online publication and is updated daily on week days.
Initial download of the metrics may take a while.