Fig. 5.
Download original image
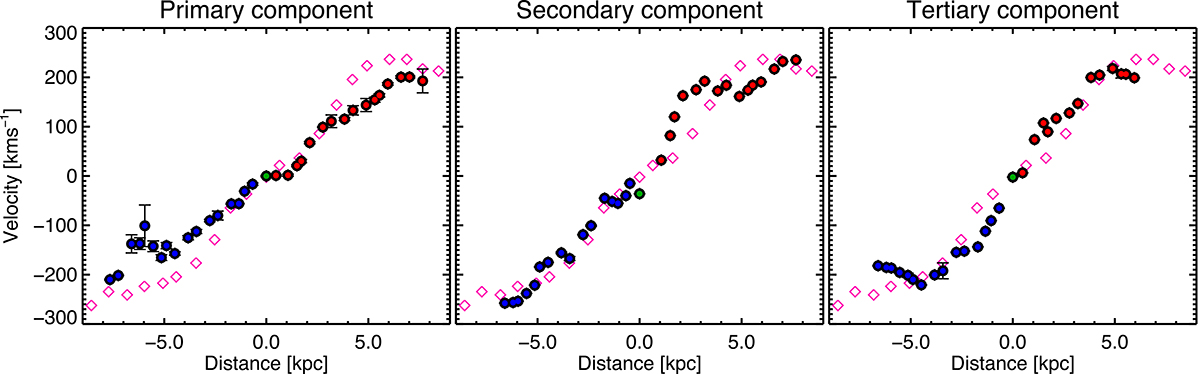
Position-velocity (P-V) curves of the different components (labelled at the top) that probe the ionised gas in Mrk 1498. The curves were obtained considering a 0![]() 8 width pseudo-slit aligned with the major rotation axis (i.e. 148°; Table 2). There is a small offset between the kinematic centre of the components (filled green circles), i.e. < 0
8 width pseudo-slit aligned with the major rotation axis (i.e. 148°; Table 2). There is a small offset between the kinematic centre of the components (filled green circles), i.e. < 0![]() 8. The radius was therefore calculated as the distance from the photometric centre (continuum peak). For comparison, the pink symbols indicate the P-V curves from Keel et al. (2012) with PA = 149°.
8. The radius was therefore calculated as the distance from the photometric centre (continuum peak). For comparison, the pink symbols indicate the P-V curves from Keel et al. (2012) with PA = 149°.
Current usage metrics show cumulative count of Article Views (full-text article views including HTML views, PDF and ePub downloads, according to the available data) and Abstracts Views on Vision4Press platform.
Data correspond to usage on the plateform after 2015. The current usage metrics is available 48-96 hours after online publication and is updated daily on week days.
Initial download of the metrics may take a while.