Fig. 9.
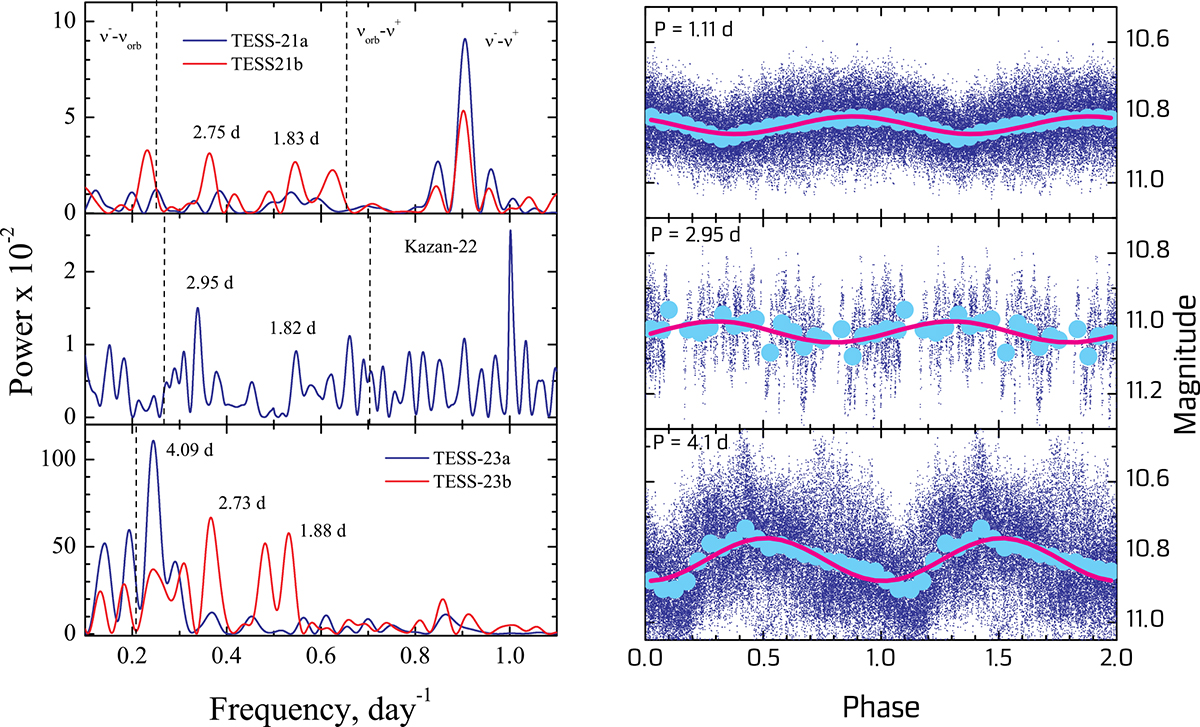
Download original image
Results of searching long periods in all the investigated light curves. Left panels: Periodograms of the light curves obtained during all the observational intervals in the frequency range of 0.1–1.1 d−1. The vertical dashed lines show the positions of the frequencies corresponding to the expected periods of the nodal (left dashed lines) and apsidal (right dashed lines in the two upper panels) precessions of the tilted elliptical accretion disk. The periods corresponding to the two most stable peaks around periods 2.7–2.9 d and 1.8–1.9 d are marked. A peak corresponding to the observation duty cycle of 1 day is also visible in the middle panel. Right panels: Light curves folded with the most significant low-frequency periods.
Current usage metrics show cumulative count of Article Views (full-text article views including HTML views, PDF and ePub downloads, according to the available data) and Abstracts Views on Vision4Press platform.
Data correspond to usage on the plateform after 2015. The current usage metrics is available 48-96 hours after online publication and is updated daily on week days.
Initial download of the metrics may take a while.