Fig. 13.
Download original image
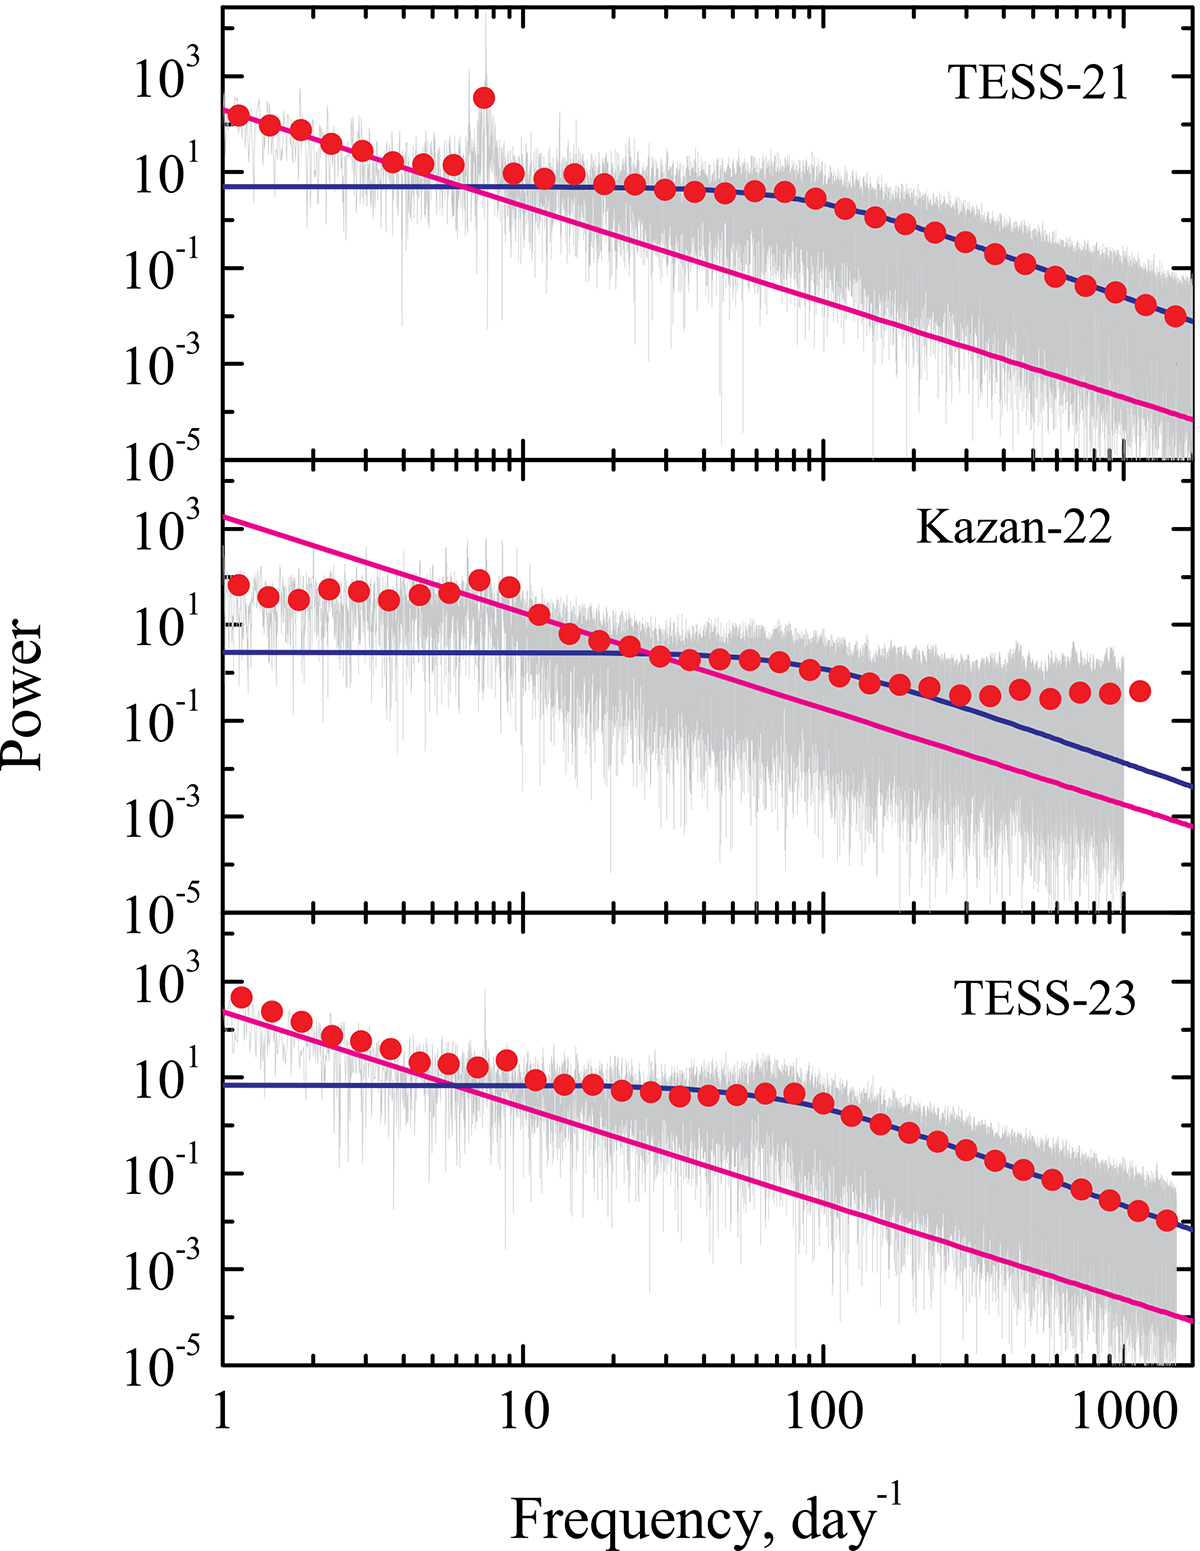
Total power spectra (gray curves) in log-log scale obtained using TESS-21 (top panel), Kazan-22 (middle panel), and TESS-23 (bottom panel) observations. The red circles show the averaged power spectra. The magenta lines show the power law with an exponent of −2, and the blue curves are the fits of the excess power spectra, represented by the formula (2) with the parameters A = 5, νc = 90 d−1, and γ = 2.2 (TESS-21), A = 2.7, νc = 90 d−1, and γ = 2.2 (Kazan-22), and A = 7, νc = 72 d−1, and γ = 2.2 (TESS-23).
Current usage metrics show cumulative count of Article Views (full-text article views including HTML views, PDF and ePub downloads, according to the available data) and Abstracts Views on Vision4Press platform.
Data correspond to usage on the plateform after 2015. The current usage metrics is available 48-96 hours after online publication and is updated daily on week days.
Initial download of the metrics may take a while.