Open Access
Fig. 4.
Download original image
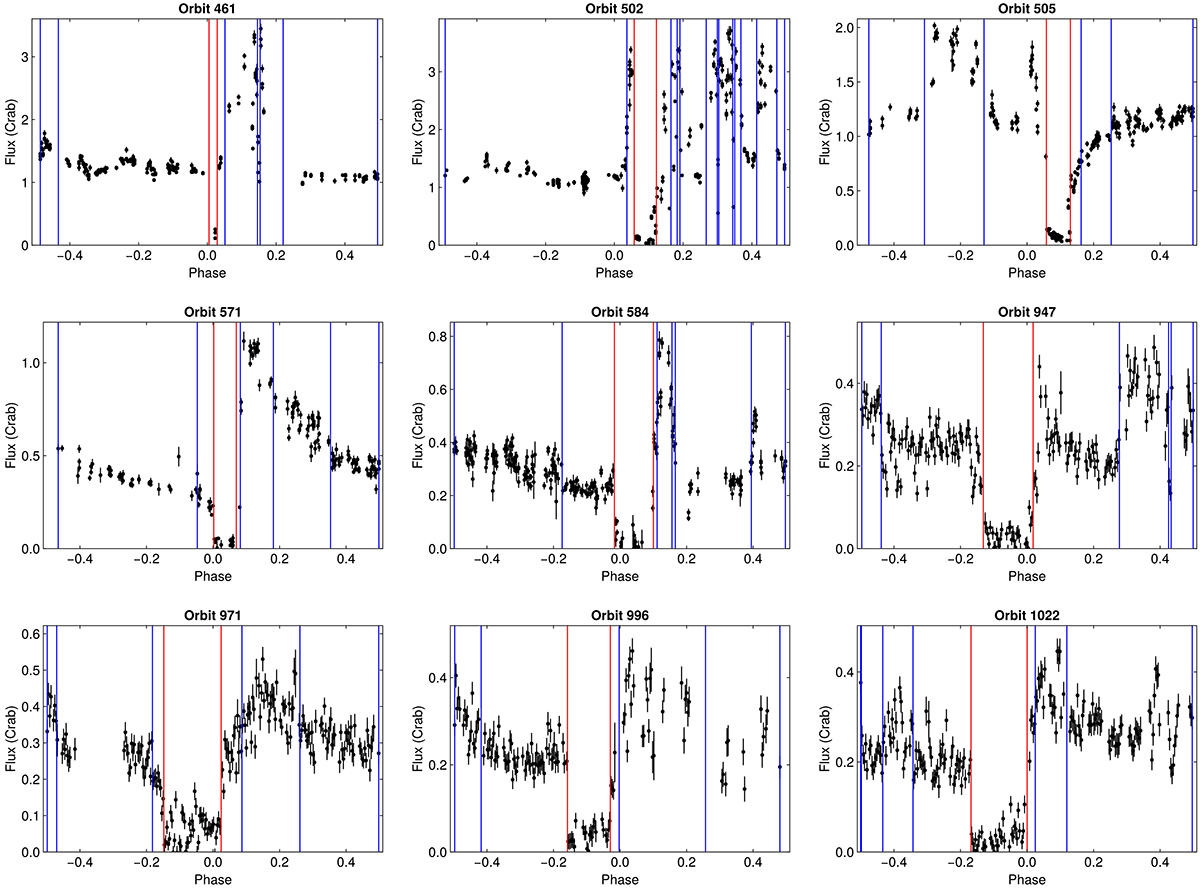
Some examples of the optimal segmentation in one orbit. The data points represent the light curves of Cir X-1 from RXTE and MAXI. The vertical lines show the edges of the optimal segmentation, where red lines are selected as the phases of dip-in and dip-out.
Current usage metrics show cumulative count of Article Views (full-text article views including HTML views, PDF and ePub downloads, according to the available data) and Abstracts Views on Vision4Press platform.
Data correspond to usage on the plateform after 2015. The current usage metrics is available 48-96 hours after online publication and is updated daily on week days.
Initial download of the metrics may take a while.