Fig. E.1.
Download original image
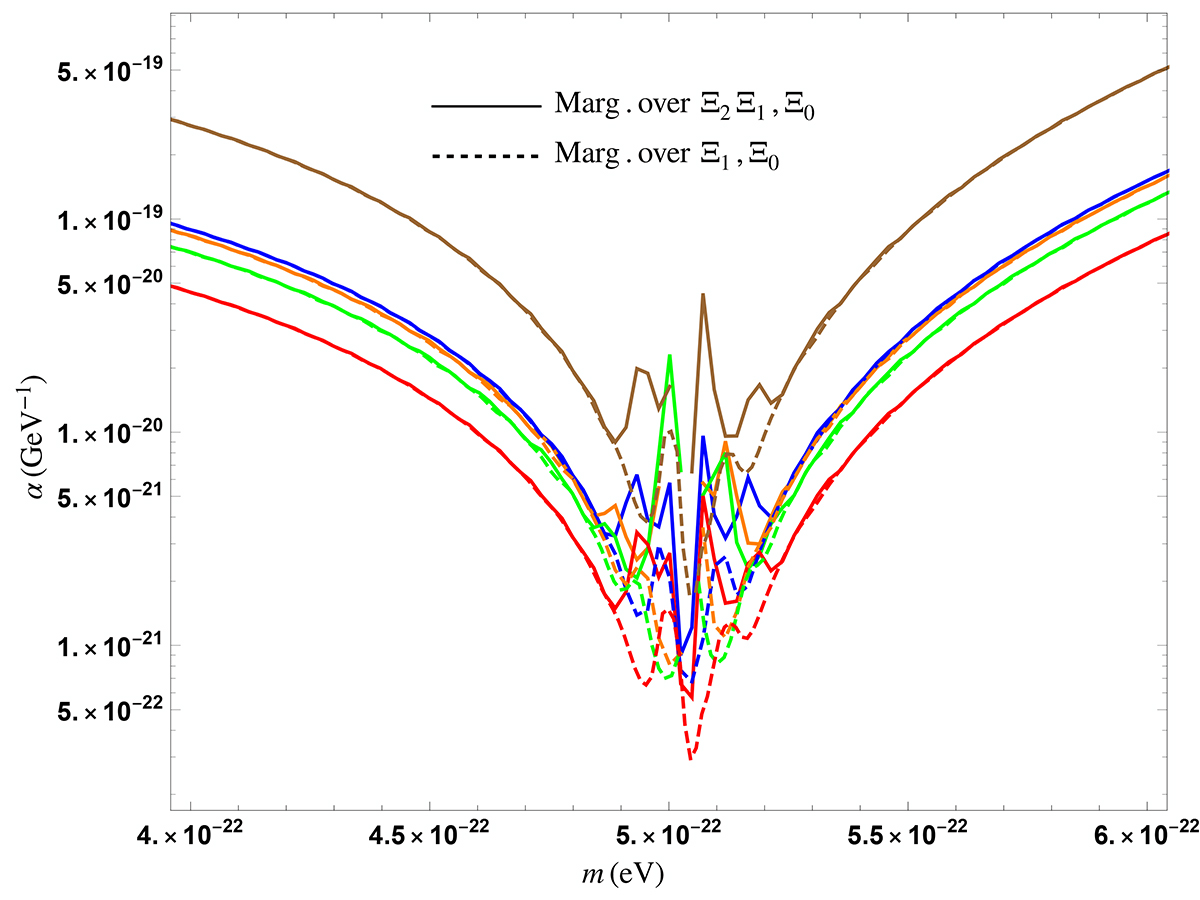
Sensitivity curves for α as a function of the ULDM mass m for the system J1903+0327 (with parameters given in Table E.2) for masses near the resonant one at ωb = m. Solid lines are obtained after marginalising over all the three nuisance parameters Ξi (i = 0, 1, 2) in the model of Θ′ (we use uniform priors for all of them), dashed lines are obtained after marginalising only over the parameters Ξ0 and Ξ1 (which correspond to a linear growth coefficient and a constant error in Θ′) while the coefficient Ξ2 (which gives a quadratic growth) is assumed to be known and subtracted so that Ξ2 = 0
Current usage metrics show cumulative count of Article Views (full-text article views including HTML views, PDF and ePub downloads, according to the available data) and Abstracts Views on Vision4Press platform.
Data correspond to usage on the plateform after 2015. The current usage metrics is available 48-96 hours after online publication and is updated daily on week days.
Initial download of the metrics may take a while.