Fig. D.1.
Download original image
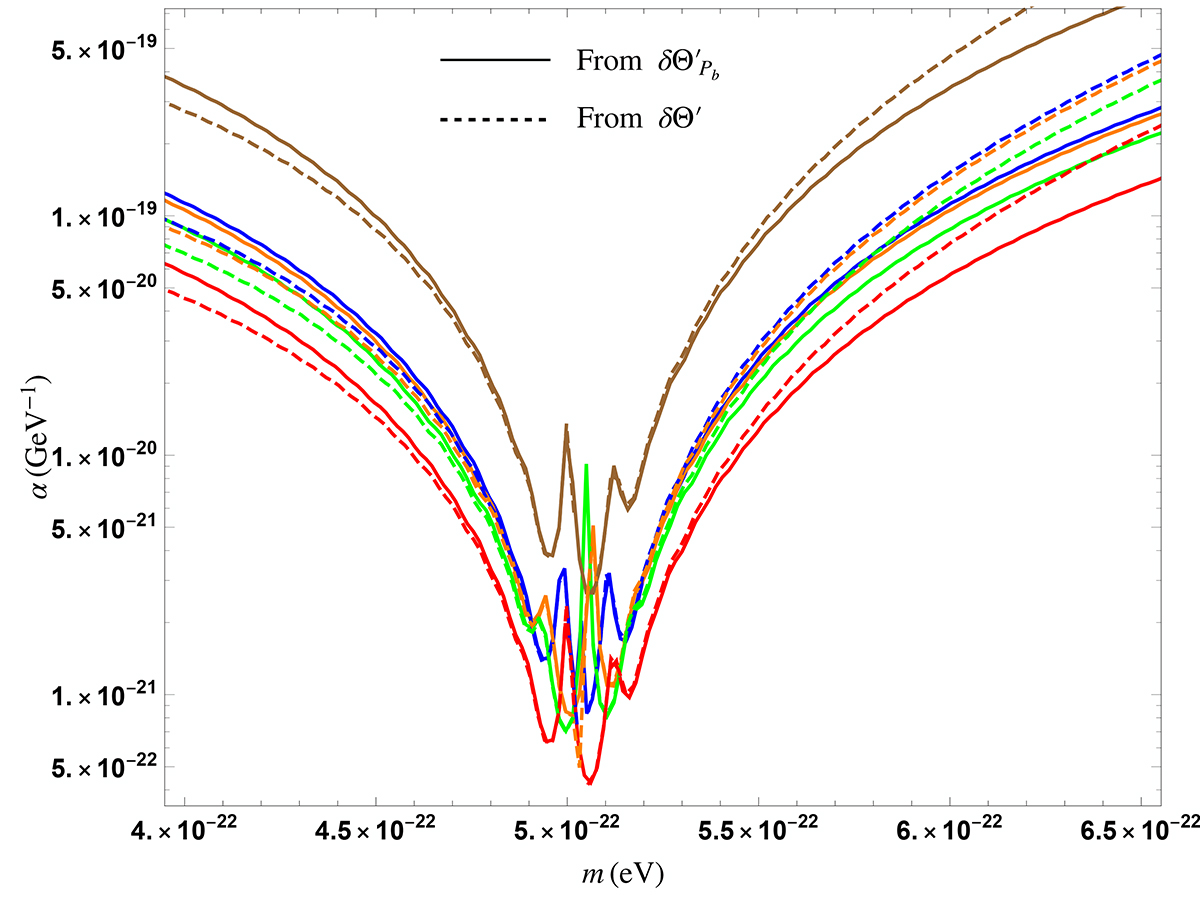
Sensitivity curves for α as a function of the ULDM mass m for the system J1903+0327 (with parameters given in Table E.2) for masses near the resonant one at ωb = m. Dashed lines account for all the ULDM effects on the parameter Θ′, while the solid lines are obtained neglecting the ULDM effect on all parameters but Pb. Each colour corresponds to a particular random realisation of the parameters 𝜚 and Υ
Current usage metrics show cumulative count of Article Views (full-text article views including HTML views, PDF and ePub downloads, according to the available data) and Abstracts Views on Vision4Press platform.
Data correspond to usage on the plateform after 2015. The current usage metrics is available 48-96 hours after online publication and is updated daily on week days.
Initial download of the metrics may take a while.