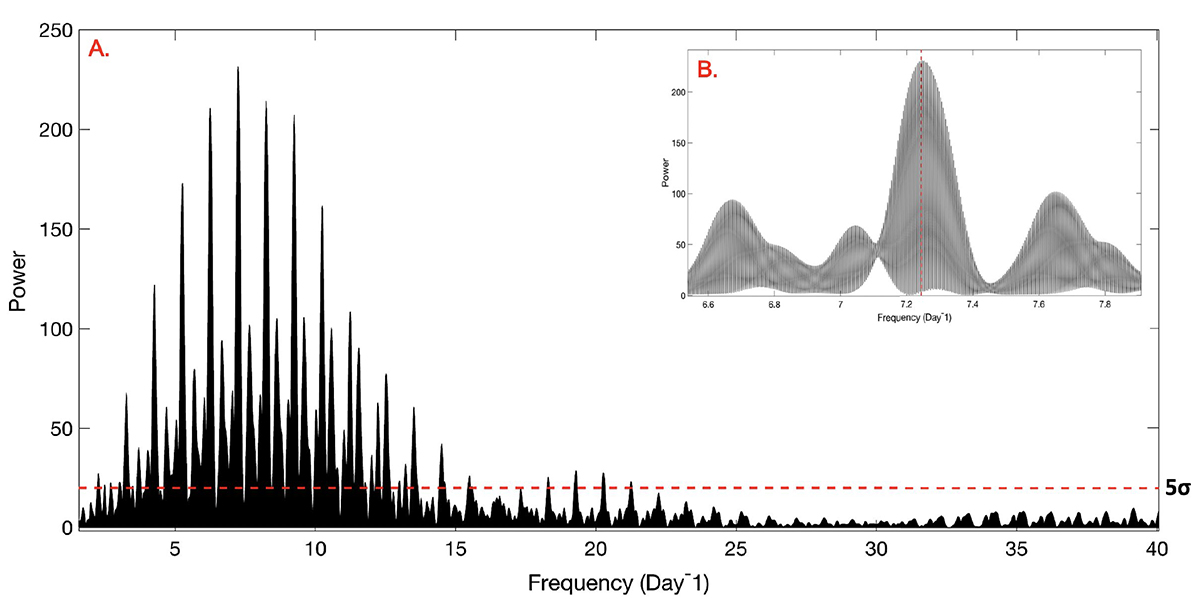
Fig. 7.
Download original image
A. Lomb-Scargle (LS) periodograms of all three epochs of the I-band GUFI photometric data of 2M J0746+20A, after subtraction of the putative ∼2.14 hours rotational period of the secondary component. The x-axis is plotted in days−1, since each epoch was time-stamped in units of Modified Heliocentric Julian Date (MHJD). The red dashed and dotted horizontal lines represent a 5σ false-alarm probability of the peaks, as defined by the LS periodogram algorithm. The mean peak-to-peak amplitude variability of 2M J0746+20A varied between 0.0014 to 0.0154 mag on different nights. B. The same LS periodogram, zoomed into the area around the highest peak. The vertical red dashed line corresponds to 3.32 ± 0.08 hours.
Current usage metrics show cumulative count of Article Views (full-text article views including HTML views, PDF and ePub downloads, according to the available data) and Abstracts Views on Vision4Press platform.
Data correspond to usage on the plateform after 2015. The current usage metrics is available 48-96 hours after online publication and is updated daily on week days.
Initial download of the metrics may take a while.