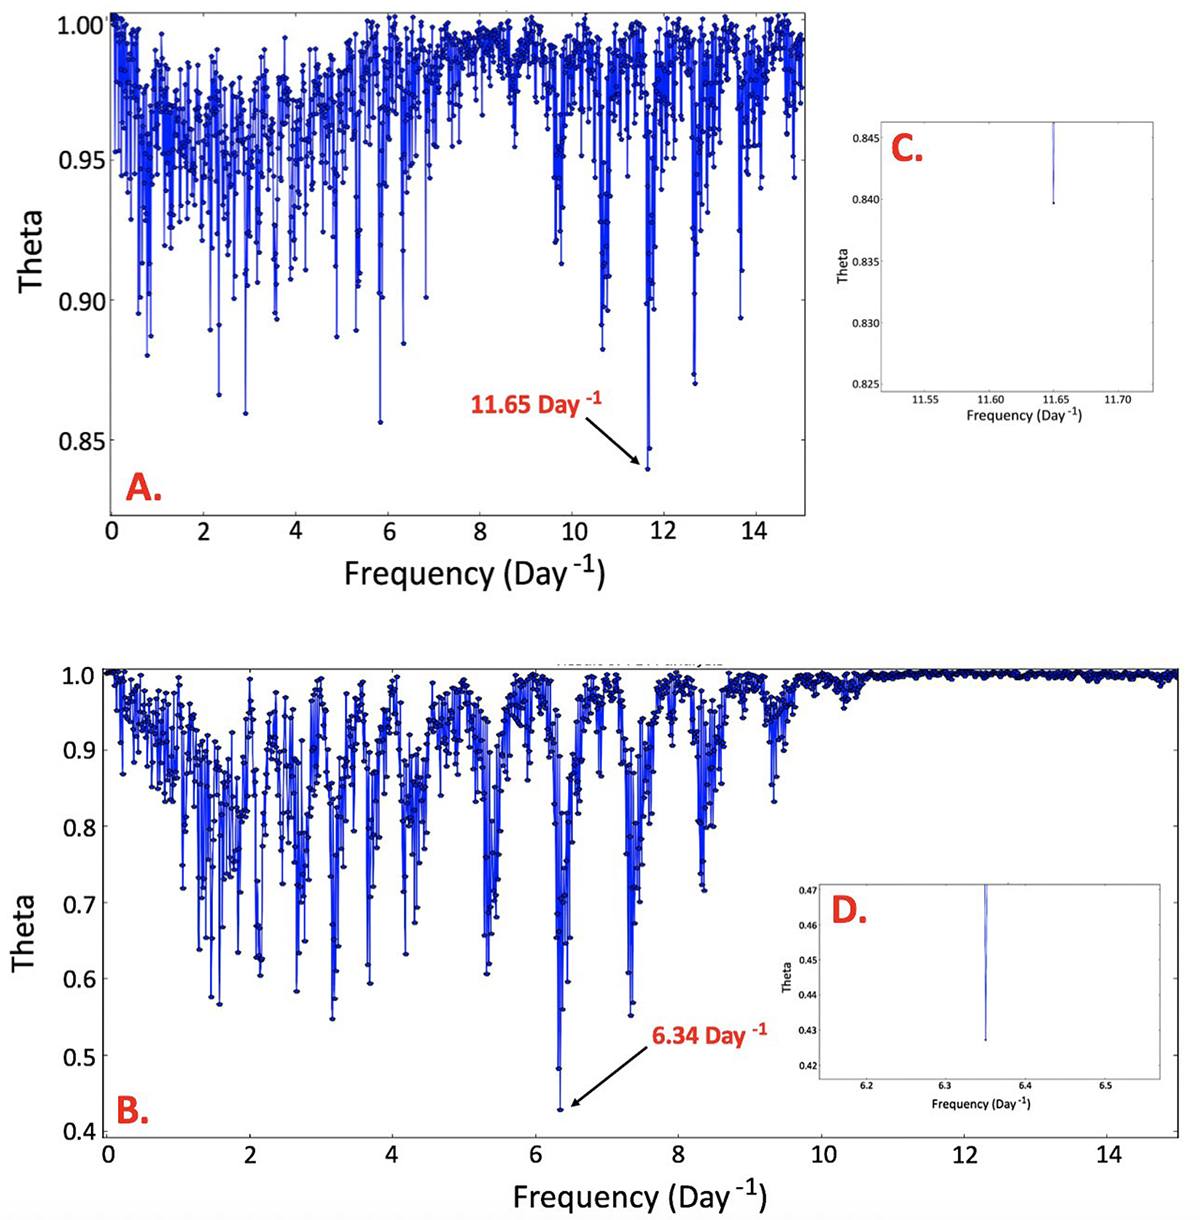
Fig. 13.
Download original image
Phase Dispersion Minimization (PDM) plots of the entire ∼1.3 year baseline for each permutation of binary component and photometric technique after running LCF. The arrow marked on each figure indicates the most significant periods after trying 105 Monte-Carlo simulations. Panel A: PDM of all epochs of the I-band data sets of 2M J1314+13A. We discovered sinusoidal photometric variability with a period of ∼2.06 hours. Panel B: PDM of all epochs of the GUFI I-band data of 2M J1314+13B. We detected a period of ∼3.78 hours. Panels C and D: close-ups of the region where theta reaches its minimum, yielding our reported periods.
Current usage metrics show cumulative count of Article Views (full-text article views including HTML views, PDF and ePub downloads, according to the available data) and Abstracts Views on Vision4Press platform.
Data correspond to usage on the plateform after 2015. The current usage metrics is available 48-96 hours after online publication and is updated daily on week days.
Initial download of the metrics may take a while.