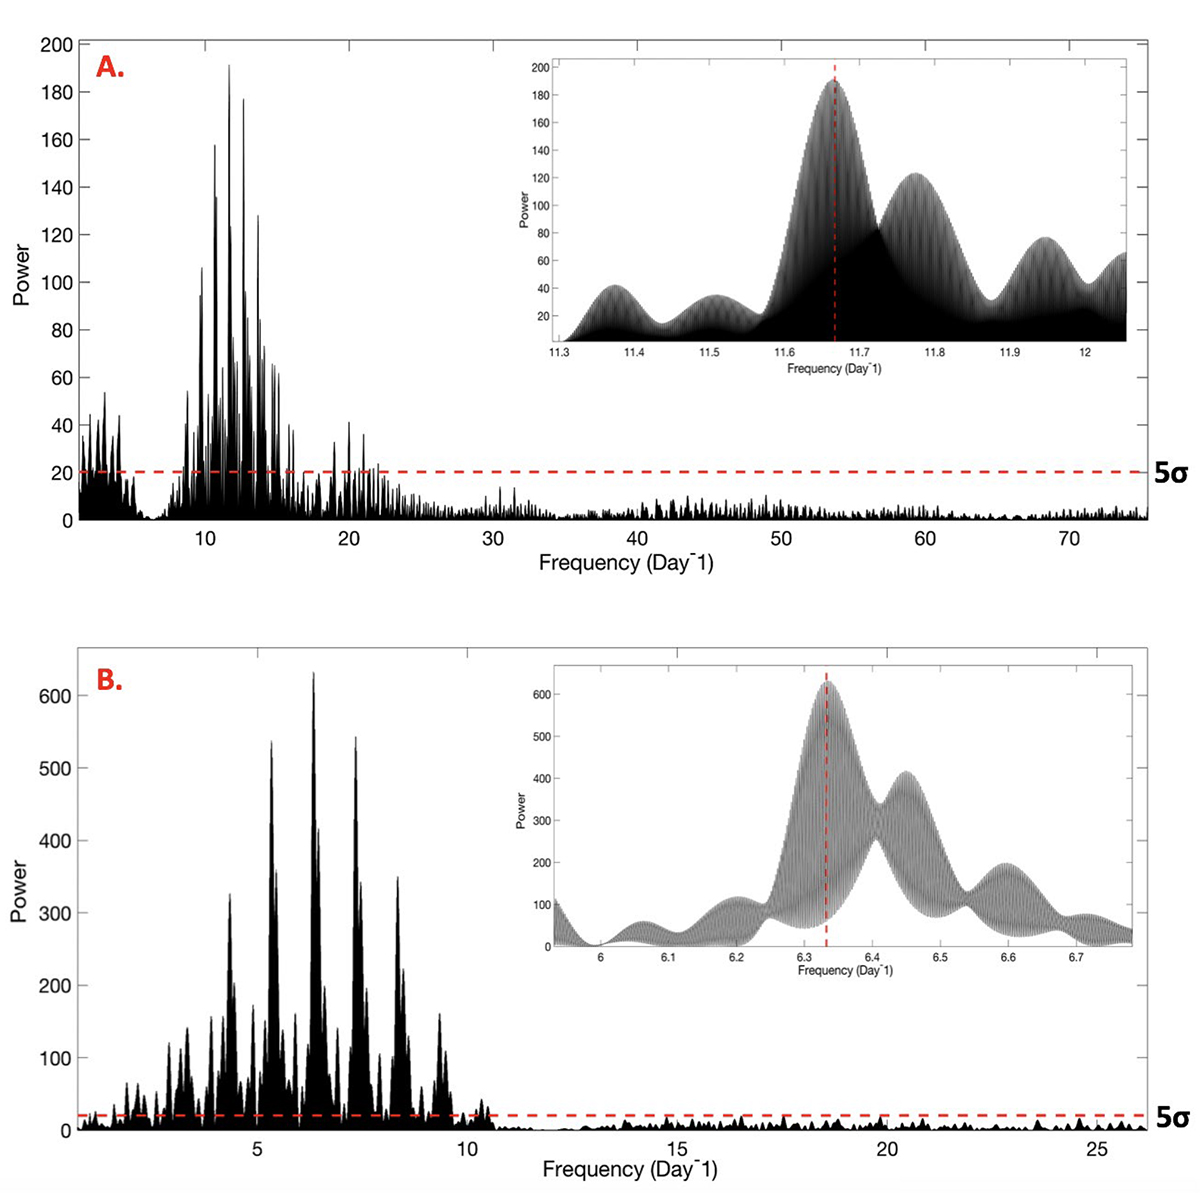
Fig. 12.
Download original image
Lomb-Scargle (LS) periodograms for each permutation of binary component and photometric technique, after isolating signal for each binary component by running LCF. Panel A: Periodogram of all epochs of the I-band GUFI photometric data of 2M J1314+13A, after subtraction of the putative rotational period of the secondary component. We discovered optical variability of 2.06 ± 0.05 hours detected as the highest peak in the periodogram. Panel B: Periodogram of all epochs of the I-band GUFI photometric data of 2M J1314+13B, after subtracting out the primary period. We indicated a periodicity of 3.79 ± 0.05 hours detected as the highest peak in the periodogram. The vertical red dashed line (shown in close-up in the inset plot) corresponds to the detected optical periods using each technique for each component. The dashed-dotted line on each plot corresponds to the 5σ false-alarm probability in each case.
Current usage metrics show cumulative count of Article Views (full-text article views including HTML views, PDF and ePub downloads, according to the available data) and Abstracts Views on Vision4Press platform.
Data correspond to usage on the plateform after 2015. The current usage metrics is available 48-96 hours after online publication and is updated daily on week days.
Initial download of the metrics may take a while.