Fig. 10.
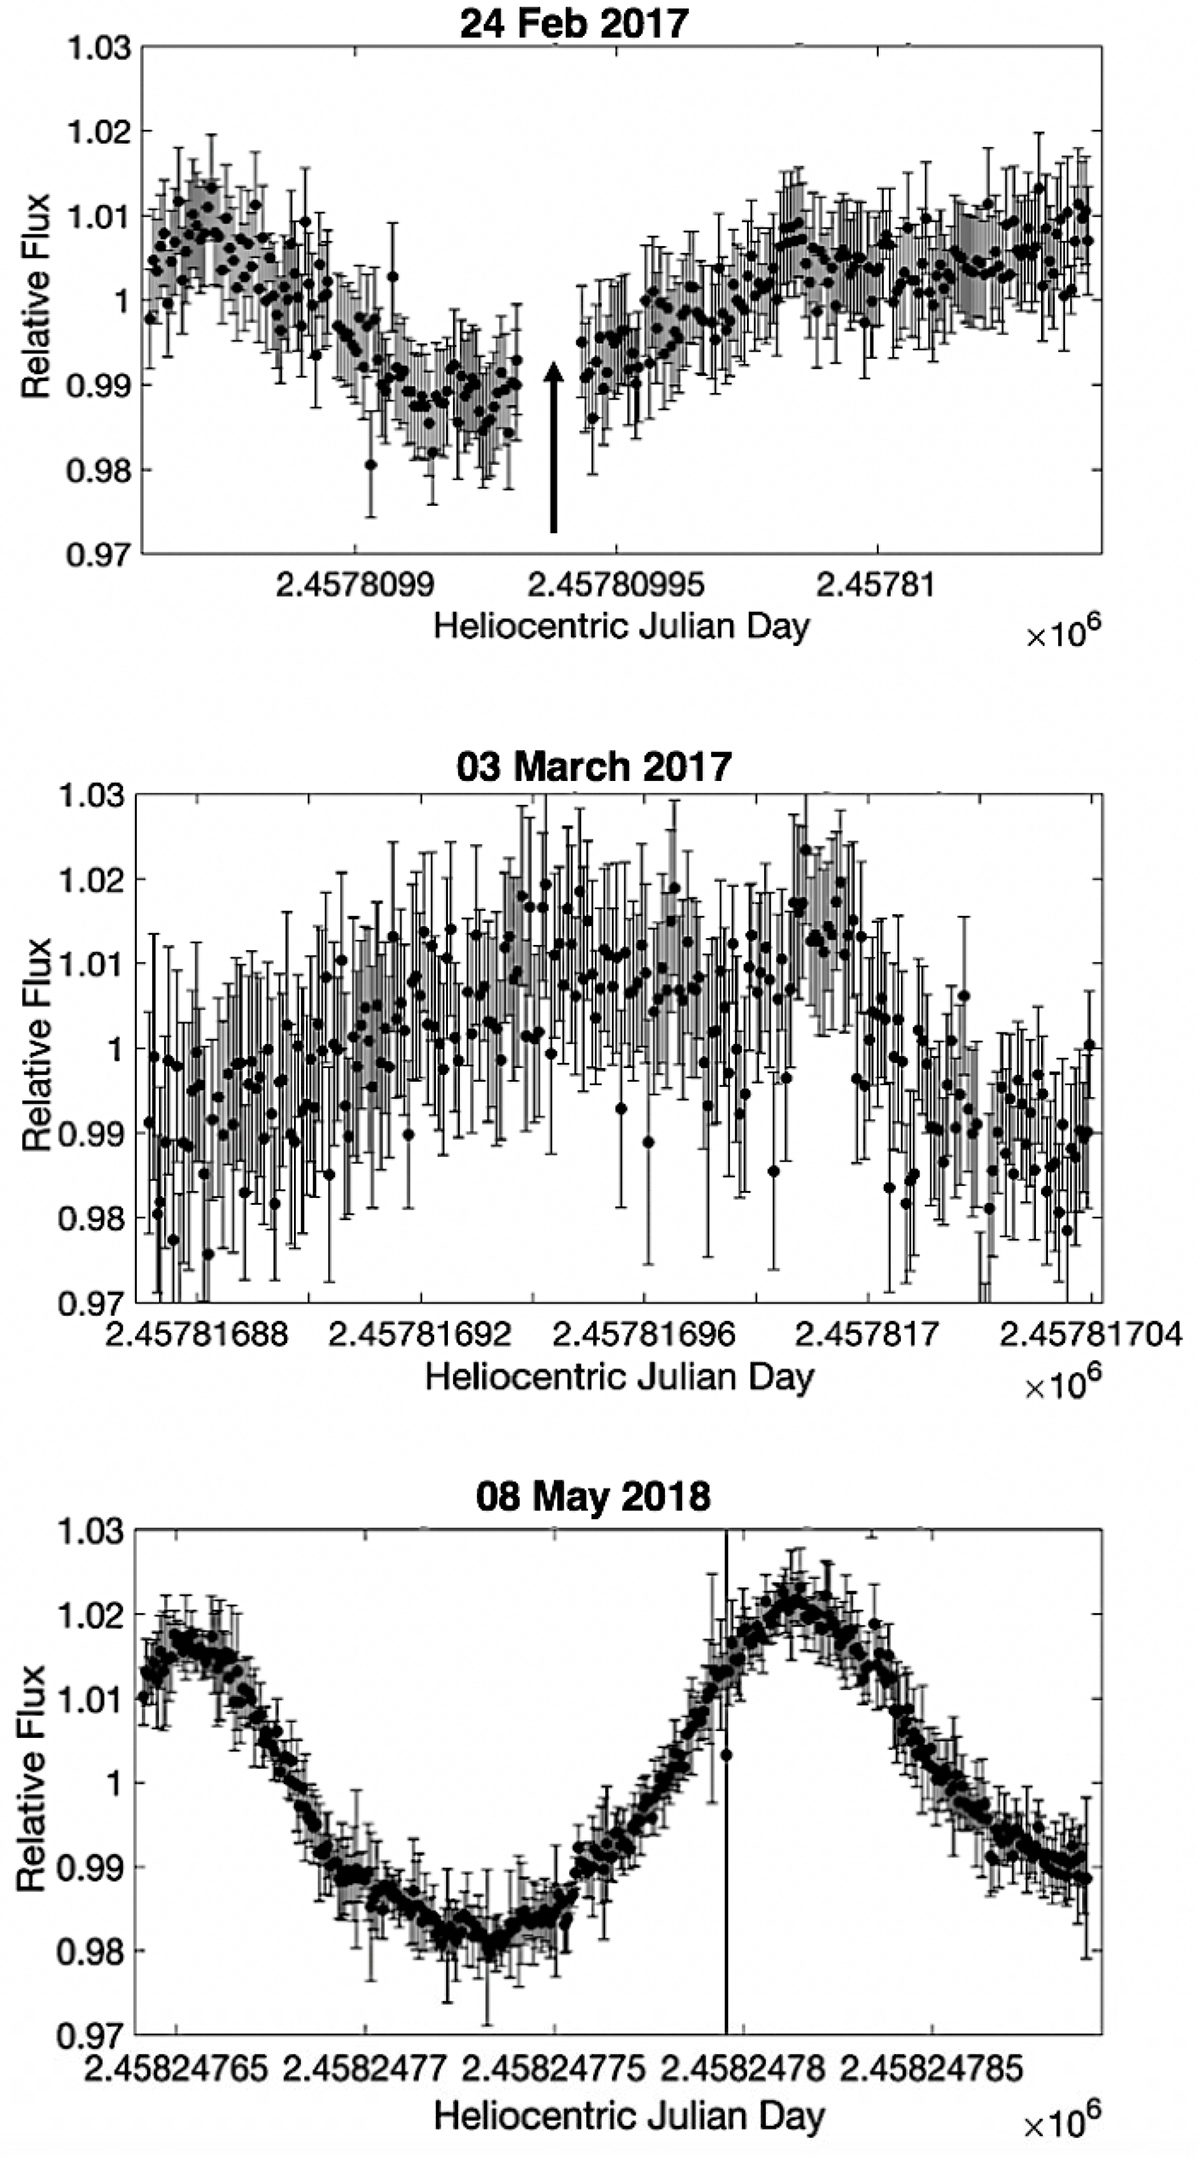
Download original image
I-band light curves of 2M J1314+13AB from three of the observation epochs. Each figure shows relative flux vs. HJD time. The HJD time above each figure denotes the start-point of each observation night. Photometric error bars were applied to each data point as listed in Table 4. Both A and B components contribute to the variability seen here. The arrows marked on the 24th Feb 2017 light curve indicates an interval of complete cloud cover; therefore these data were removed.
Current usage metrics show cumulative count of Article Views (full-text article views including HTML views, PDF and ePub downloads, according to the available data) and Abstracts Views on Vision4Press platform.
Data correspond to usage on the plateform after 2015. The current usage metrics is available 48-96 hours after online publication and is updated daily on week days.
Initial download of the metrics may take a while.