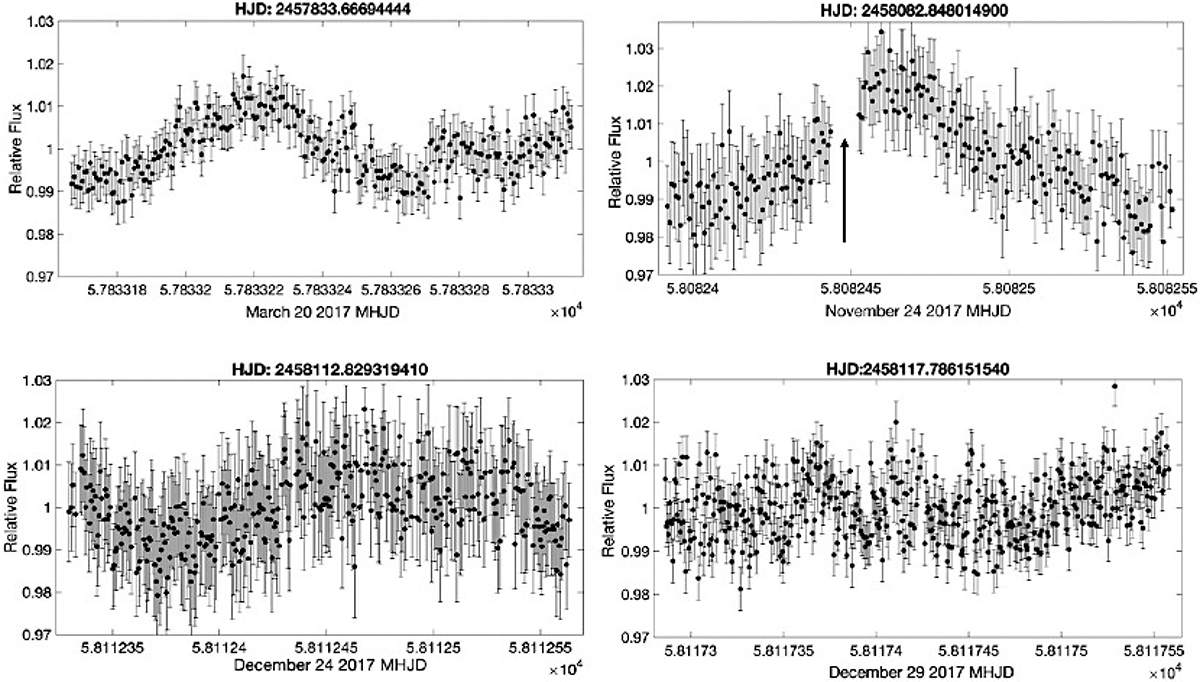
Fig. 1.
Download original image
Representative I-band photometric timeseries from four out of sixteen nights when 2M J0746+20AB was observed. Target flux relative to 5–6 reference stars is plotted against Modified Heliocentric Julian Date (MHJD). The HJD time above each figure denotes the start-point of each observation night. Both components of the binary contribute to the variability seen here. Possibly aperiodic variations are observed in some light curves (e.g. 29th December 2017). The arrow marked on the 24th November 2017 light curve indicates a period of full cloud coverage, and this data has been removed. The December 24th 2017 data were taken during bad weather conditions (thin cloud). The impact is shown clearly by an increase in the photometric error bars and an increase in the scatter of the light curve itself.
Current usage metrics show cumulative count of Article Views (full-text article views including HTML views, PDF and ePub downloads, according to the available data) and Abstracts Views on Vision4Press platform.
Data correspond to usage on the plateform after 2015. The current usage metrics is available 48-96 hours after online publication and is updated daily on week days.
Initial download of the metrics may take a while.