Open Access
Fig. A.3.
Download original image
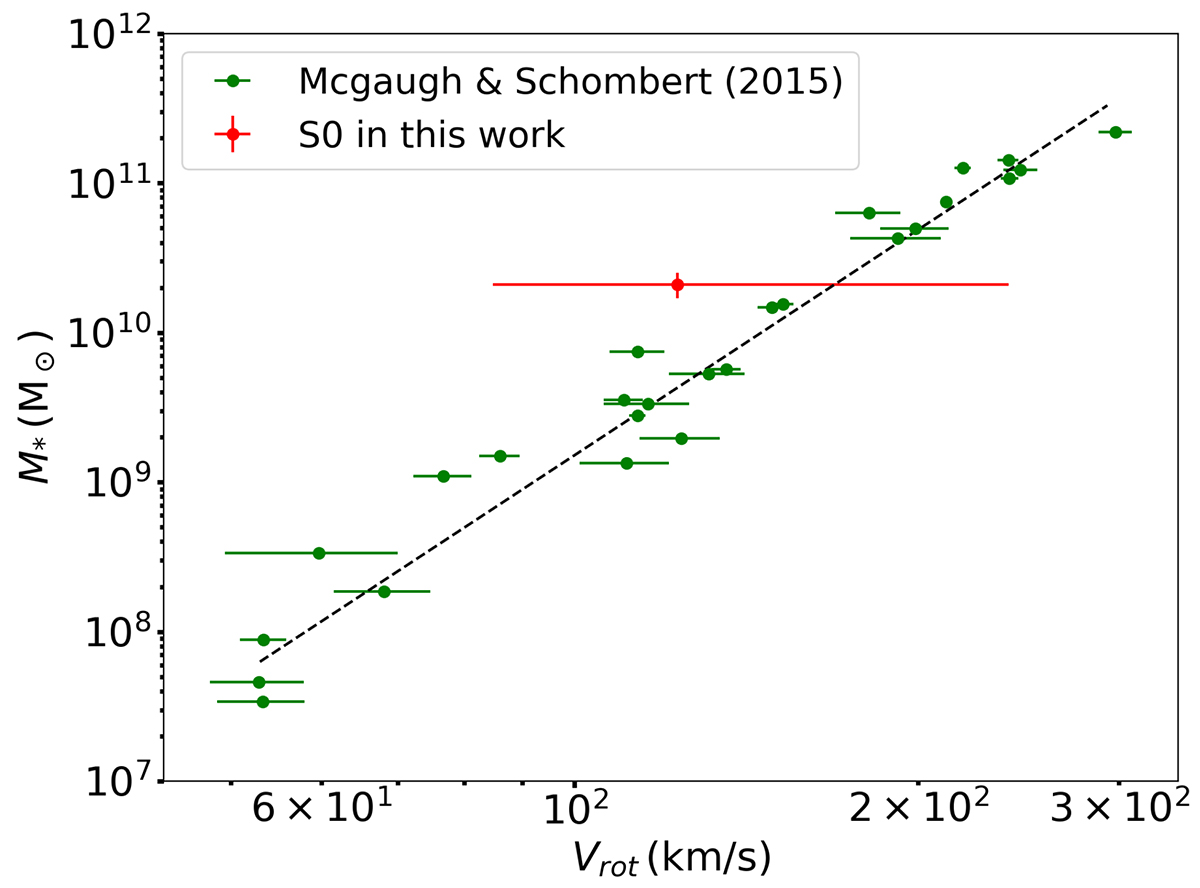
Stellar-mass TFR. The green points show the sample of galaxies at z ≃ 0 from McGaugh & Schombert (2015), their Table 7), and the dashed line shows the corresponding best-fitting relation. The red point shows the S0 spiral at z = 1.49 from this work with 1σ uncertainty, which is consistent with the local TFR.
Current usage metrics show cumulative count of Article Views (full-text article views including HTML views, PDF and ePub downloads, according to the available data) and Abstracts Views on Vision4Press platform.
Data correspond to usage on the plateform after 2015. The current usage metrics is available 48-96 hours after online publication and is updated daily on week days.
Initial download of the metrics may take a while.