Open Access
Fig. A.1.
Download original image
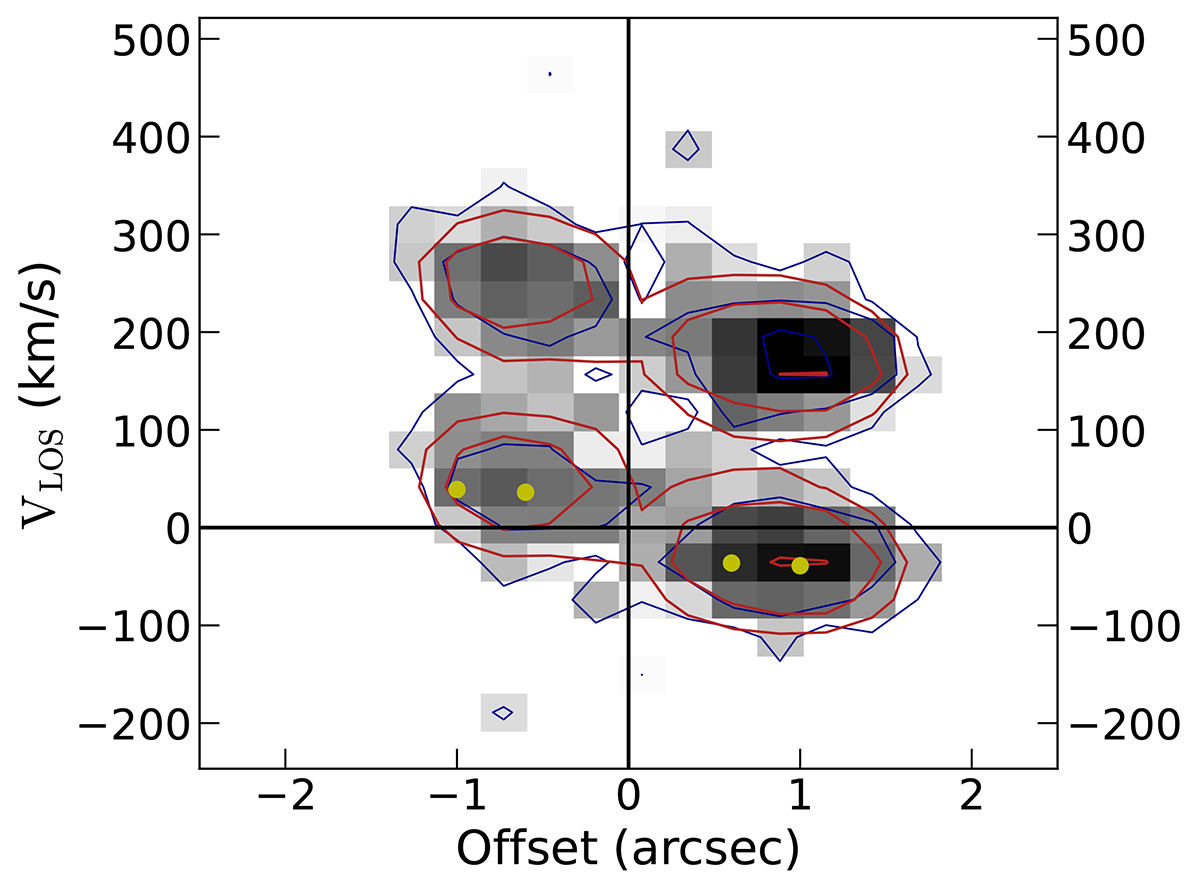
Position-velocity diagram along the major axis of S0(d) for the [OII] doublet. The contour levels and color coding are the same as in Fig. 2. The yellow points show the position on the S0(d) image where we have secure velocity measurements. We set the VLoS = 0 km s−1 at the center of [OII]λ3726 Å emission line.
Current usage metrics show cumulative count of Article Views (full-text article views including HTML views, PDF and ePub downloads, according to the available data) and Abstracts Views on Vision4Press platform.
Data correspond to usage on the plateform after 2015. The current usage metrics is available 48-96 hours after online publication and is updated daily on week days.
Initial download of the metrics may take a while.