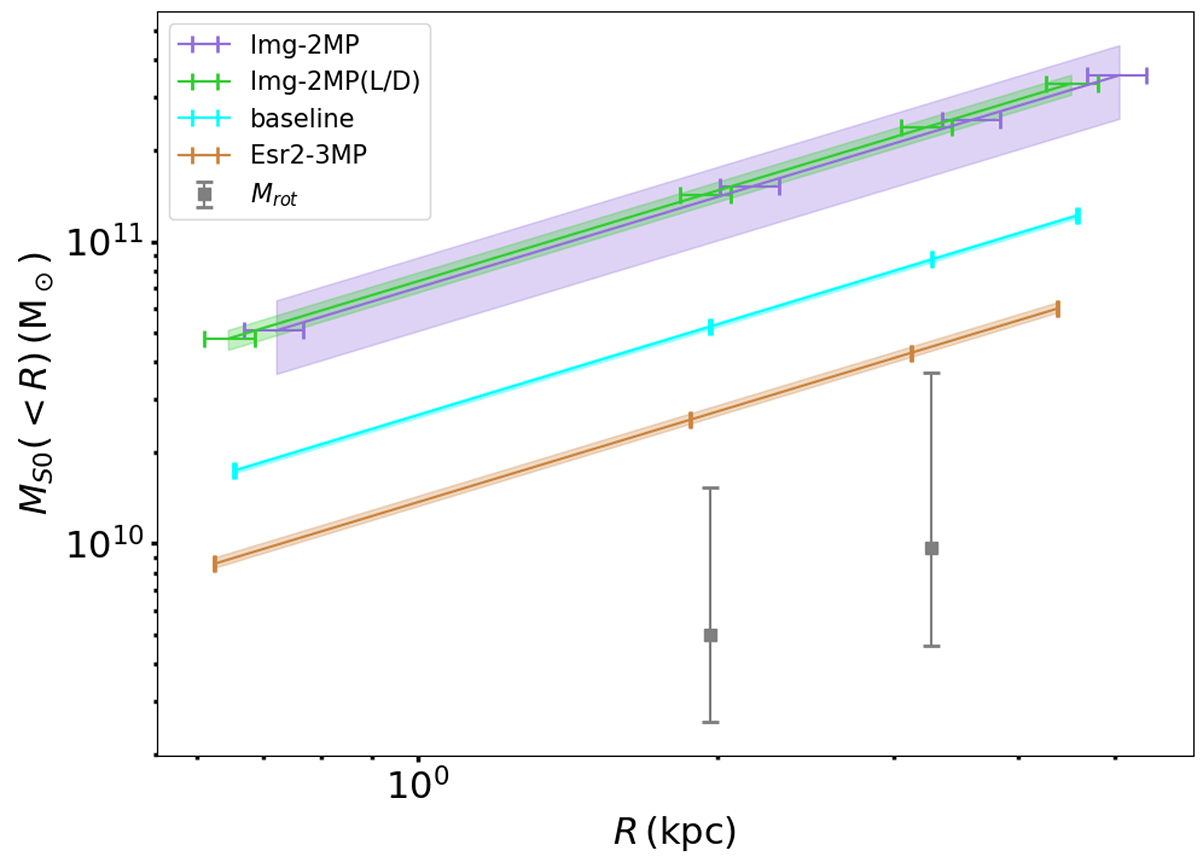
Fig. 4.
Download original image
Comparison of mass distributions for the spiral galaxy S0 at source plane from strong lensing and kinematic modeling. The solid lines show the S0 mass estimated from lens models using Eq. (6), given different datasets as constraints (see Table 1). The statistical 1σ uncertainty of the S0 mass from lens models is estimated from the 16th, 50th, and 84th percentiles of the posterior probability distribution functions (PDFs). The 1σ uncertainty along the x-axis of the S0 mass is determined from the magnification modification using Eq. (2). The gray squares show the S0 mass estimated from kinematic modeling using Eq. (1). The radial distance of the gray squares is divided by the μ from the baseline model. The error bar shows 1σ uncertainties associated with the range of inclination angles.
Current usage metrics show cumulative count of Article Views (full-text article views including HTML views, PDF and ePub downloads, according to the available data) and Abstracts Views on Vision4Press platform.
Data correspond to usage on the plateform after 2015. The current usage metrics is available 48-96 hours after online publication and is updated daily on week days.
Initial download of the metrics may take a while.