Fig. 2.
Download original image
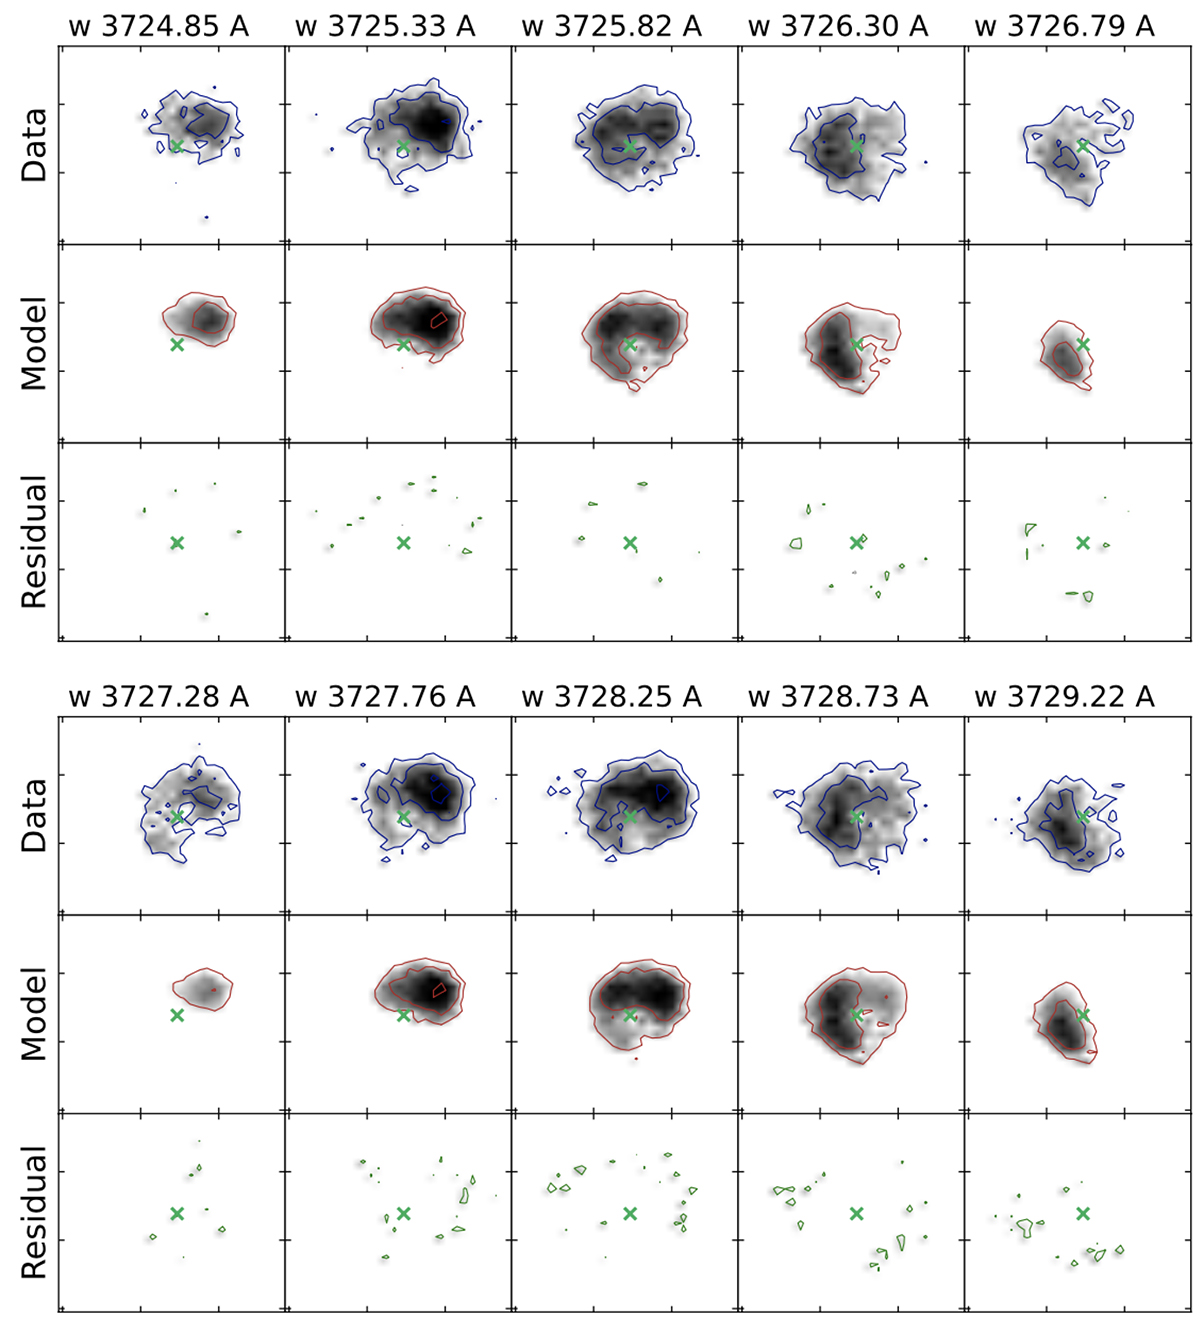
Comparison between MUSE IFS of image S0(d) (blue contours) and the 3DBarolo model (red contours). The third row in the upper and bottom panels shows the residuals. Contour levels are set at 2σn, where the σ noise = 2 × 10⁻²⁰ erg s−1 cm−2 Å−1 and n = 1, 2, 4, 8. The green cross shows the centroid position of S0(d). This plot shows the fitting result for the two lines of the [OII] emission doublet at (rest frame) λ = 3726 Å and 3729 Å in the upper and bottom panels, respectively.
Current usage metrics show cumulative count of Article Views (full-text article views including HTML views, PDF and ePub downloads, according to the available data) and Abstracts Views on Vision4Press platform.
Data correspond to usage on the plateform after 2015. The current usage metrics is available 48-96 hours after online publication and is updated daily on week days.
Initial download of the metrics may take a while.