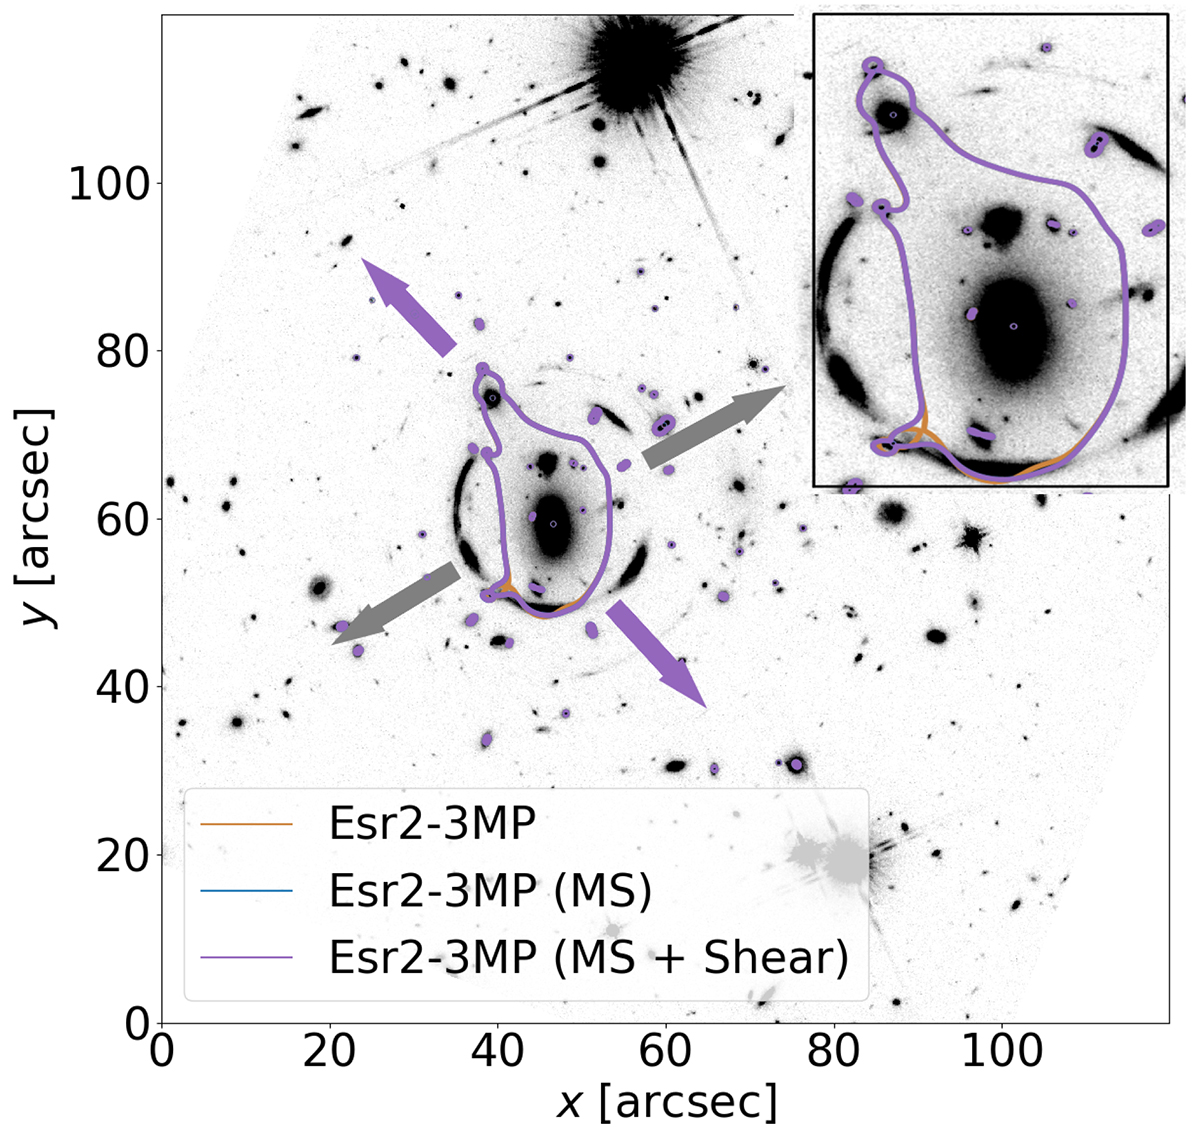
Fig. B.2.
Download original image
Critical curves for the lens plane at z = 1.36 in three-lens-plane models. The Esr2−3MP model uses an isothermal mass profile to model the mass distribution at z = 1.36. Meanwhile, the Esr2−3MP (MS) model uses a constant mass sheet, and the Esr2−3MP (MS + Shear) model uses a constant mass sheet with an external shear. The purple and gray arrows indicate the mass concentrations predicted by the external shear at z = 1.36 and z = 0.683, respectively, in the model Esr2−3MP (MS + Shear). The critical curves for these models nearly overlap, with the orange and blue lines largely hidden beneath the purple line.
Current usage metrics show cumulative count of Article Views (full-text article views including HTML views, PDF and ePub downloads, according to the available data) and Abstracts Views on Vision4Press platform.
Data correspond to usage on the plateform after 2015. The current usage metrics is available 48-96 hours after online publication and is updated daily on week days.
Initial download of the metrics may take a while.