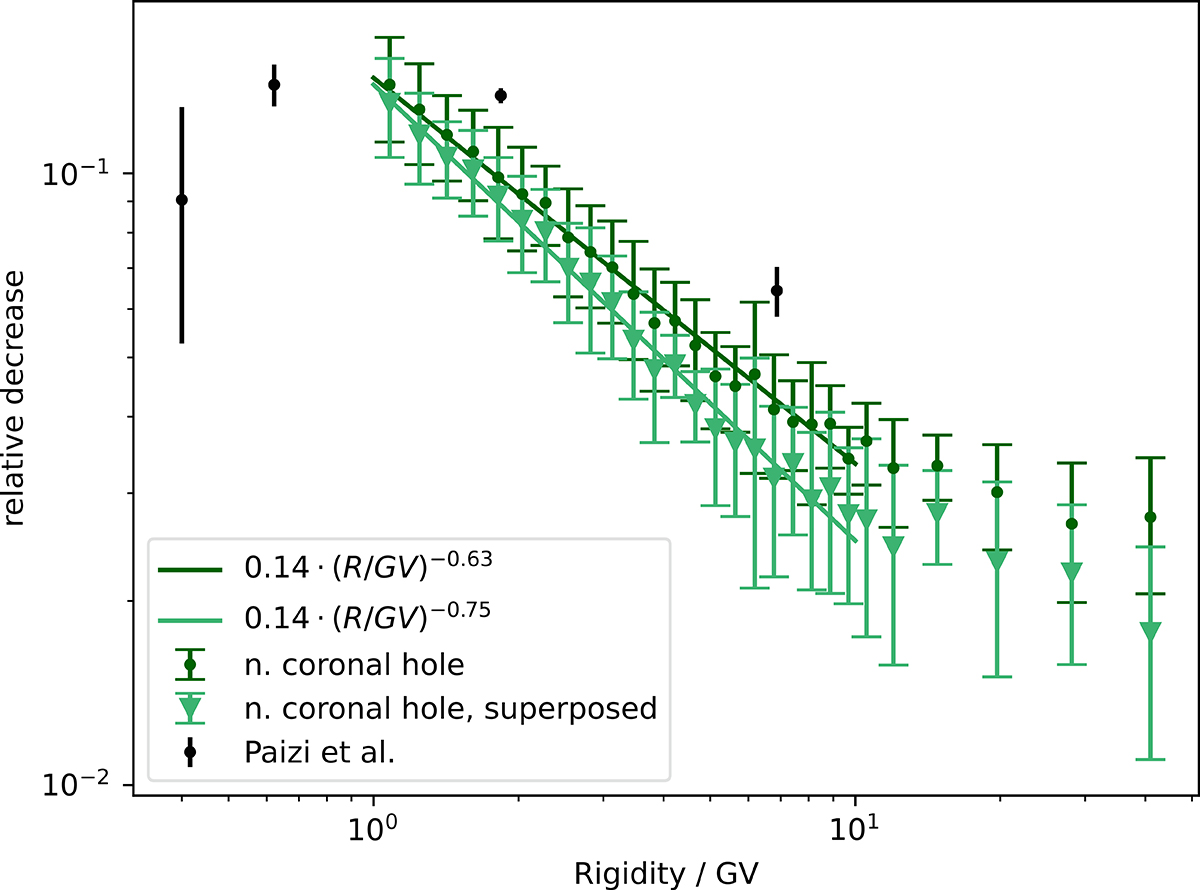
Fig. 6.
Download original image
Relative amplitudes of FDs vs. rigidity. Dark green displays the averaging of the five FDs while light green is based on the superposed epoch analysis. The dark green points are identical to Fig. 4 (same as in Fig. 3). The relative amplitudes have been fitted by a power law in the rigidity range from 1–10 GV for both methods. For comparison, the data from Paizis et al. (1999) are shown in black.
Current usage metrics show cumulative count of Article Views (full-text article views including HTML views, PDF and ePub downloads, according to the available data) and Abstracts Views on Vision4Press platform.
Data correspond to usage on the plateform after 2015. The current usage metrics is available 48-96 hours after online publication and is updated daily on week days.
Initial download of the metrics may take a while.