Open Access
Fig. 5.
Download original image
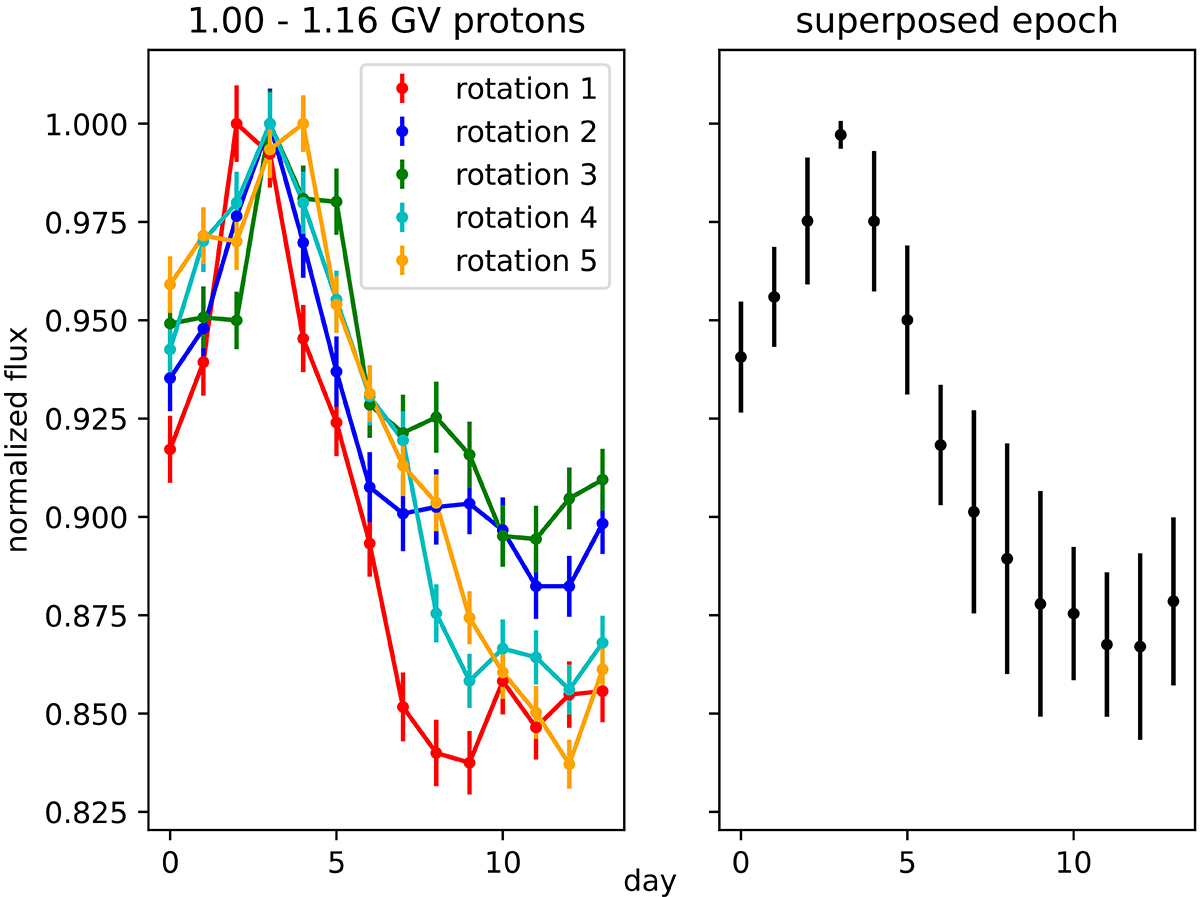
Normalized AMS-02 1.00–1.16 GV proton flux vs. day (left). Colors indicate different time periods of five analyzed solar rotations. The periods shown are similar to the green periods in Fig. 3. Averaged normalized flux for every day (right).
Current usage metrics show cumulative count of Article Views (full-text article views including HTML views, PDF and ePub downloads, according to the available data) and Abstracts Views on Vision4Press platform.
Data correspond to usage on the plateform after 2015. The current usage metrics is available 48-96 hours after online publication and is updated daily on week days.
Initial download of the metrics may take a while.