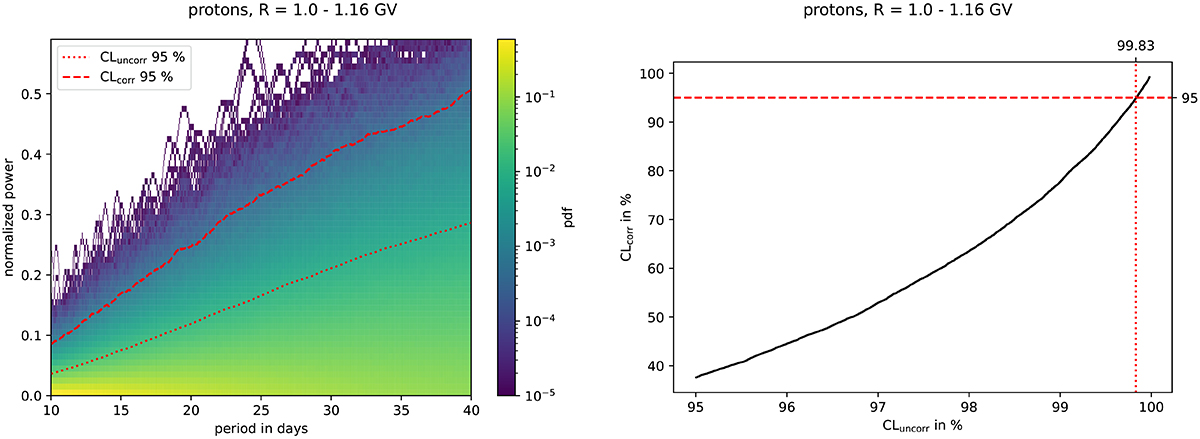
Fig. B.2.
Download original image
PDFs used to obtain a certain normalized power at a given period for 1 GV protons (left). The auto correlation coefficient for this figure is α = 0.89. The dotted red line marks the uncorrected confidence level CLuncorr of 95 %. Overall, 5 % of all power values exceed the CLuncorr at a given period . The dashed red line marks a CLuncorr of 99.83 %. This confidence level is only exceeded by 5 % of all periodograms at any period. Right: The relation between corrected and uncorrected CL is shown. The dotted and dashed red lines mark a CLuncorr of 95 %, which corresponds to a CLcorr of 99.83 %.
Current usage metrics show cumulative count of Article Views (full-text article views including HTML views, PDF and ePub downloads, according to the available data) and Abstracts Views on Vision4Press platform.
Data correspond to usage on the plateform after 2015. The current usage metrics is available 48-96 hours after online publication and is updated daily on week days.
Initial download of the metrics may take a while.