Open Access
Fig. B.1.
Download original image
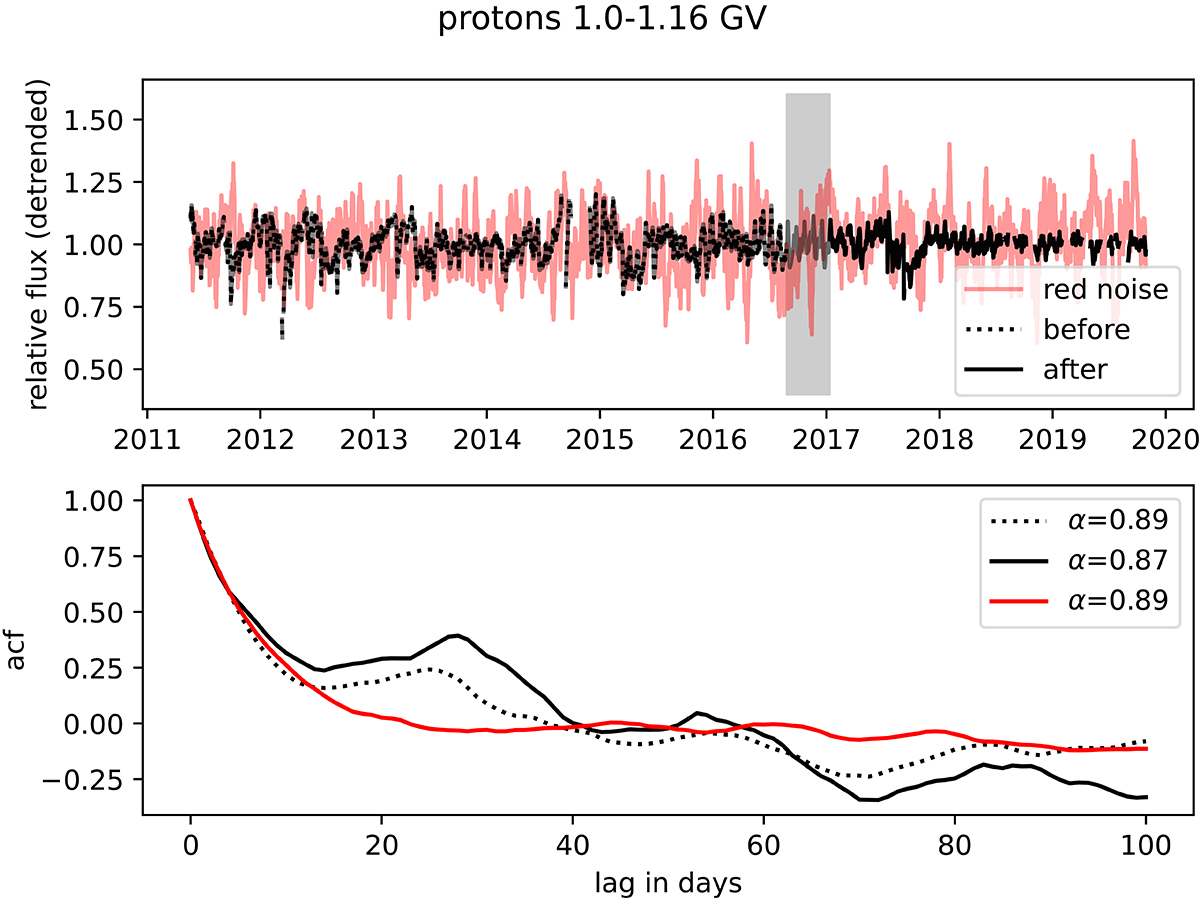
Detrended AMS-02 proton flux at 1 GV (black lines) and estimated background modeled by red noise (red line), shown at the top. The grey shaded area marks the analysis period of this work. Bottom panel: Auto correlation of the above time series.
Current usage metrics show cumulative count of Article Views (full-text article views including HTML views, PDF and ePub downloads, according to the available data) and Abstracts Views on Vision4Press platform.
Data correspond to usage on the plateform after 2015. The current usage metrics is available 48-96 hours after online publication and is updated daily on week days.
Initial download of the metrics may take a while.