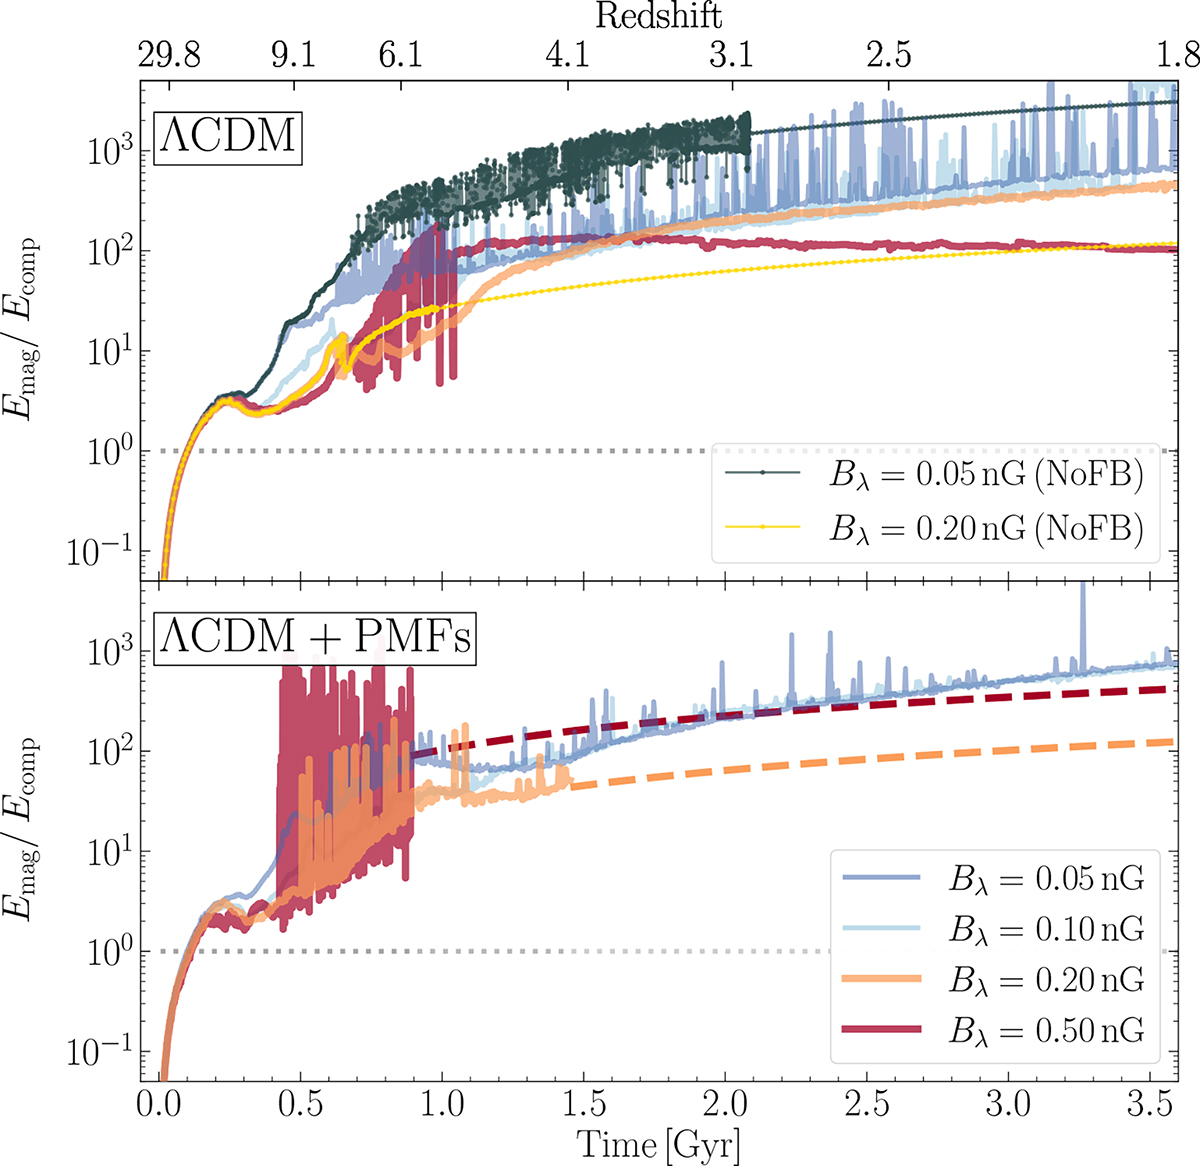
Fig. 4.
Download original image
Time evolution of the ratio of magnetic energy to compression energy in the galactic region (white circle in Fig. 2) for all the simulations during the first 3.5 Gyr. The upper and lower panels corresponds to all the models in ΛCDM and ΛCDM+PMFs settings, respectively. The green and yellow dotted lines in the top panel represent B0.05 and B0.20 models re-simulated without supernovae feedback. The more rapid increase in Emag compared to Ecomp demonstrates the amplification of magnetic fields, even with a week seed (e.g., Bλ = 0.05 nG), through gas accretion, halo collapse and mergers. This amplification occurs in models with the fiducial value of supernovae feedback ESN = 1051 erg and with zero feedback.
Current usage metrics show cumulative count of Article Views (full-text article views including HTML views, PDF and ePub downloads, according to the available data) and Abstracts Views on Vision4Press platform.
Data correspond to usage on the plateform after 2015. The current usage metrics is available 48-96 hours after online publication and is updated daily on week days.
Initial download of the metrics may take a while.