Fig. 3.
Download original image
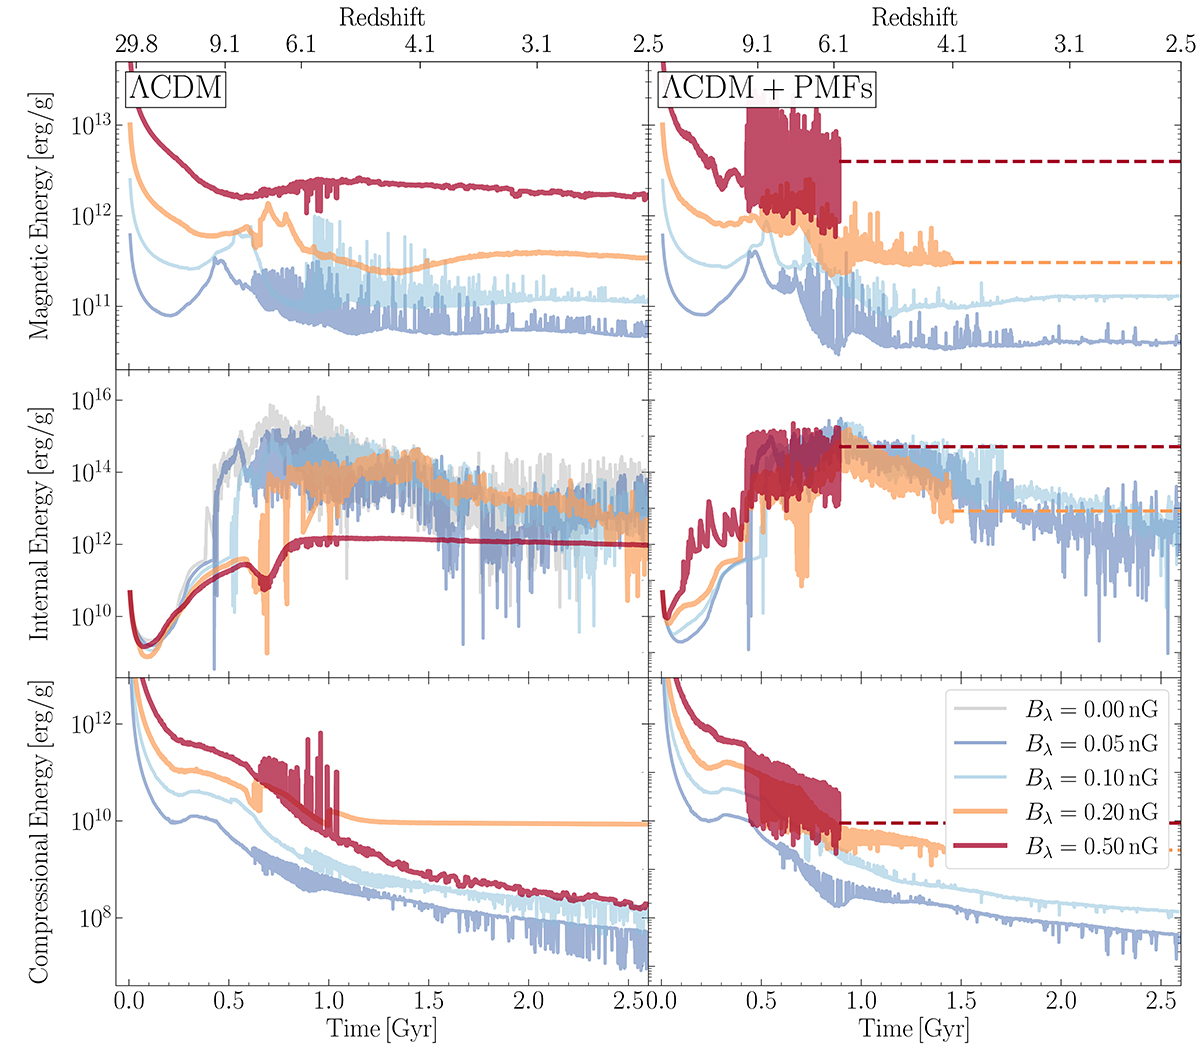
Comparison of different specific energy components within the galactic region (white circle in Fig. 2) of h070. The left and right panels represent all the MHD runs emerging from a standard ΛCDM and ΛCDM+PMFs matter power spectrum, respectively. The upper panels show the time evolution of specific magnetic energy. The ratio of magnetic energy between different models with initial seeds between 0.05 to 0.50 nG increases by a factor smaller than Bλ2/8π, suggesting energy loss due to magnetic field saturation, including energy dissipation during the collapse. The middle panels show the specific internal energy, which tracks the onset and rate of star formation. The lower panels show the estimate for the compressional part of the magnetic energy from isotropic adiabatic gas collapse. Magnetic energy initially follows the compressional energy as ![]() , until magnetic field amplification causes a deviation in their time evolution.
, until magnetic field amplification causes a deviation in their time evolution.
Current usage metrics show cumulative count of Article Views (full-text article views including HTML views, PDF and ePub downloads, according to the available data) and Abstracts Views on Vision4Press platform.
Data correspond to usage on the plateform after 2015. The current usage metrics is available 48-96 hours after online publication and is updated daily on week days.
Initial download of the metrics may take a while.