Fig. 1.
Download original image
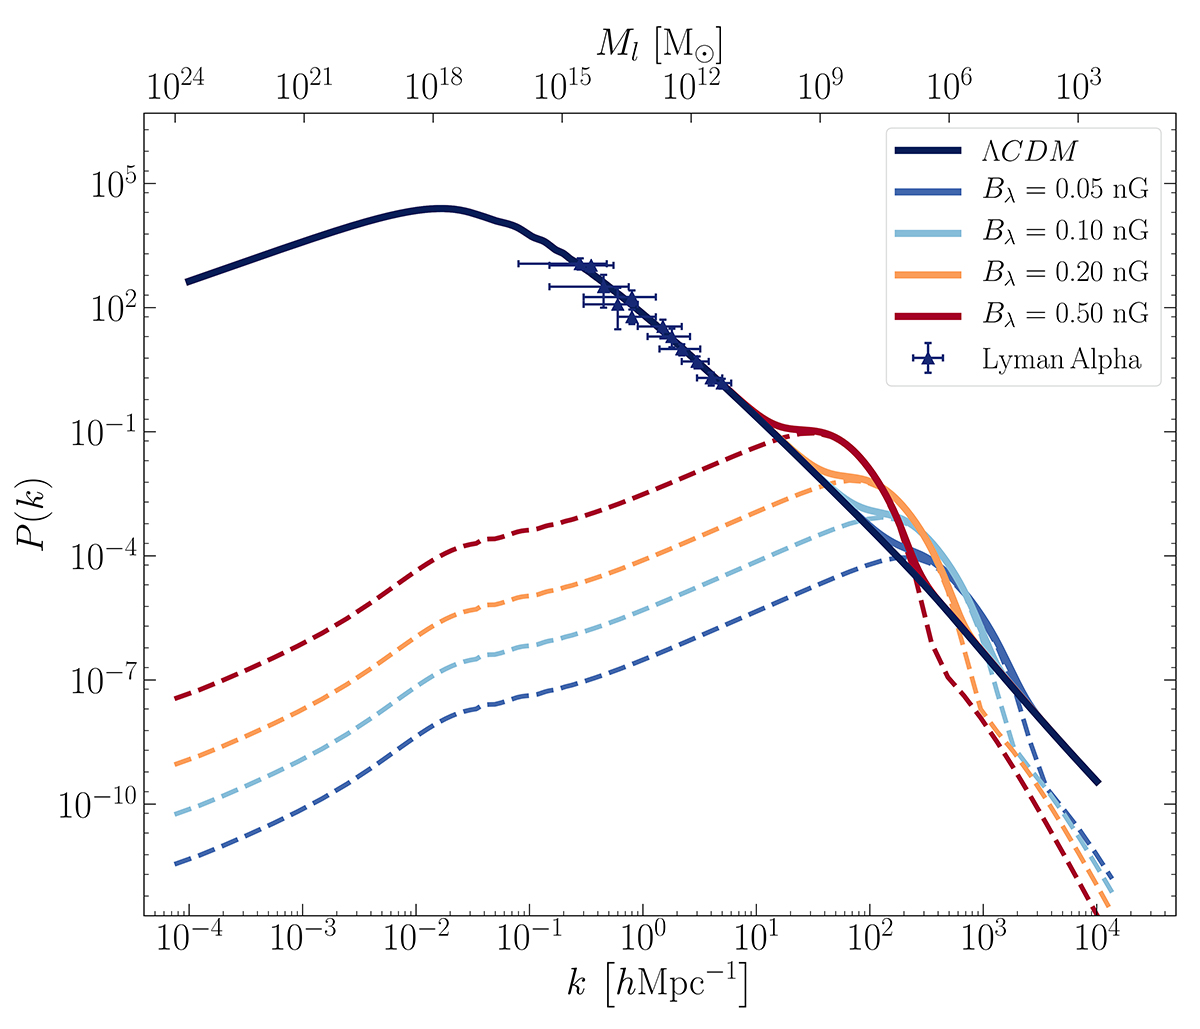
Impact of primordial magnetic fields on the matter power spectrum varying with increasing field strength. Dashed lines illustrate the distribution of matter induced by primordial magnetic fields, while the solid lines represent the combination of these magnetic-induced matter perturbations and the perturbations produced during inflation. The unperturbed ΛCDM spectrum is shown as the dark blue solid line. The amplitude of the magnetic field is varying from 0.05 to 0.50 nG, while the spectral slope is kept constant at nB = −2.9. The triangles with error bars represent Lyman Alpha data (Tegmark & Zaldarriaga 2002) as the observational constraints on the matter power spectrum at the smallest mass scales.
Current usage metrics show cumulative count of Article Views (full-text article views including HTML views, PDF and ePub downloads, according to the available data) and Abstracts Views on Vision4Press platform.
Data correspond to usage on the plateform after 2015. The current usage metrics is available 48-96 hours after online publication and is updated daily on week days.
Initial download of the metrics may take a while.