Fig. 9
Download original image
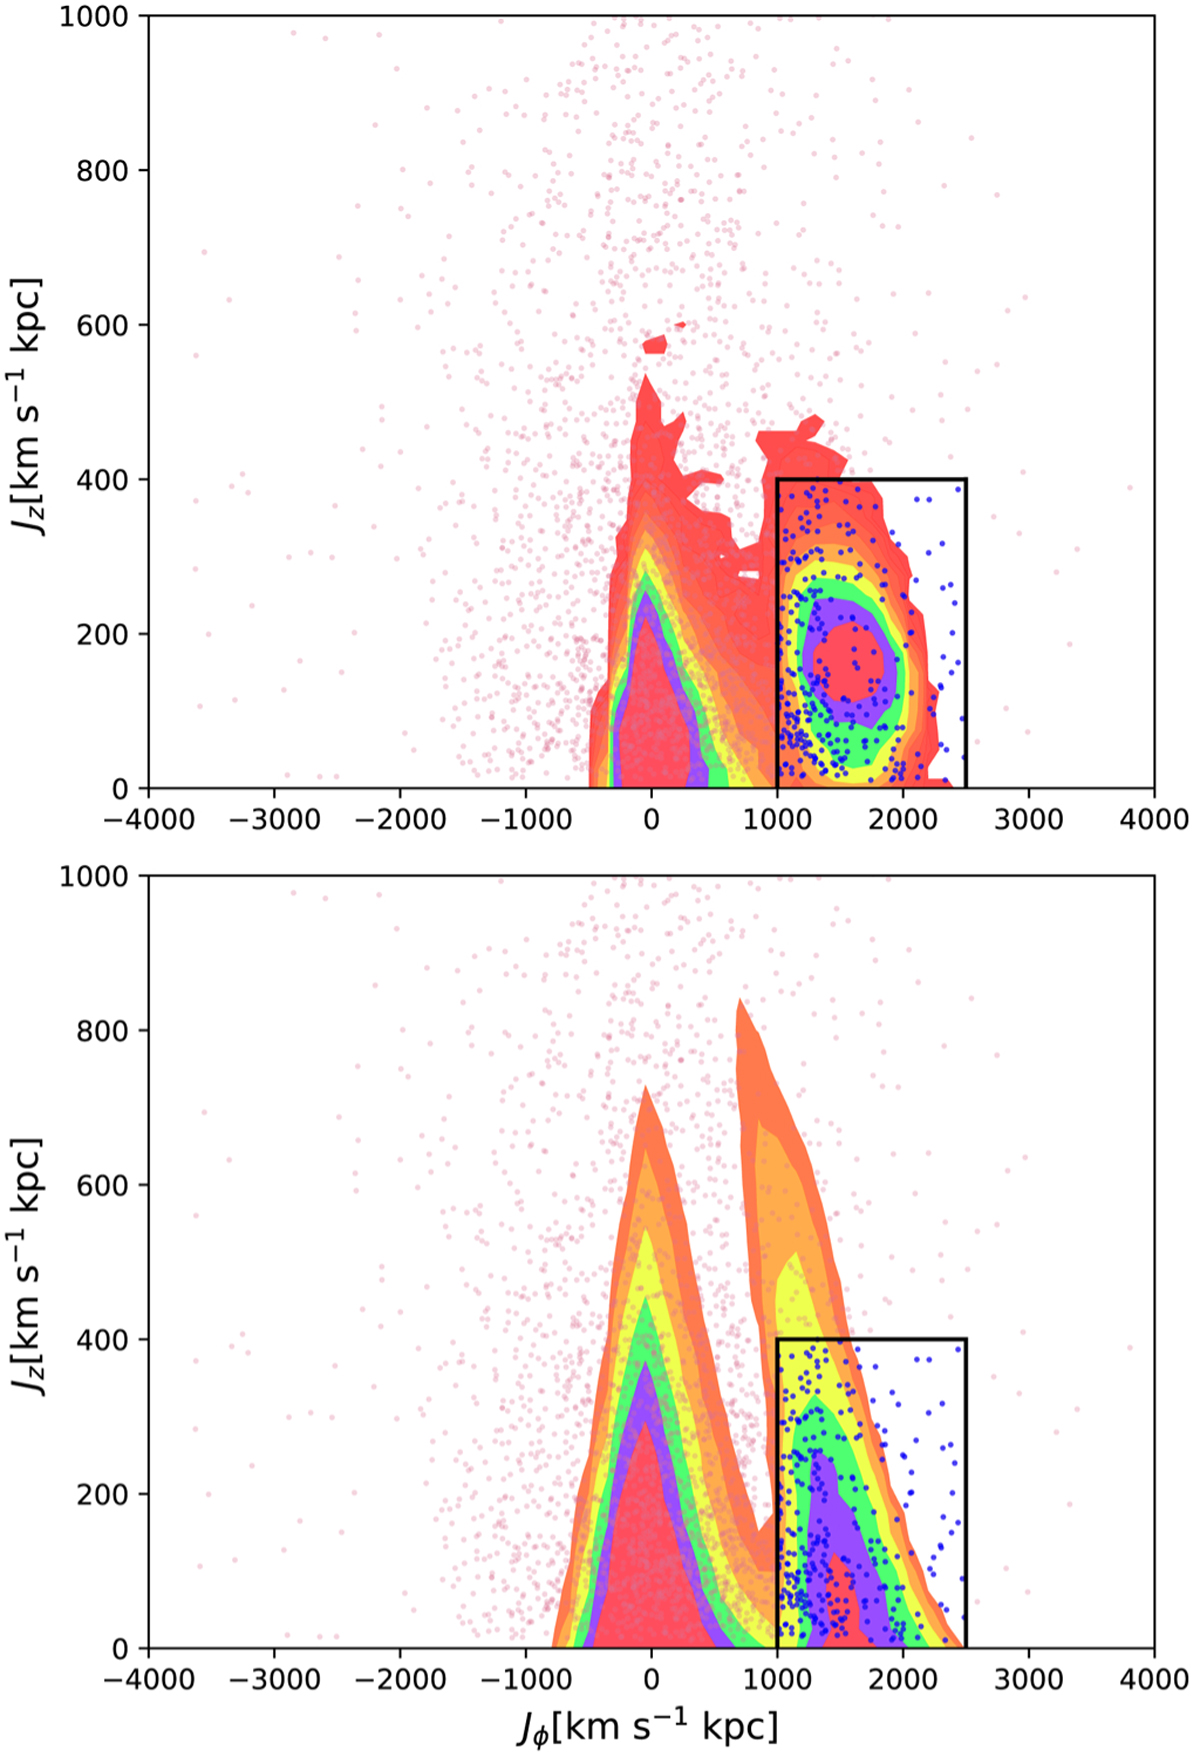
Final Jϕ-Jz distribution for both the simulation result with a decelerating bar (with a boxy/peanut bulge) and the observational data, shown in the upper panel. The contours show the distribution for very metal-poor pseudo-stars, with a clear bi-modal distribution. The pseudo-stars with Jϕ > 1000 denote the population that is driven outwards by the decelerating bar. The black box represents the selection criteria and the blue stars represent the same stars as those plotted in Figure 10. The simulation result coincides with the observations well. In order to make a comparison with another bulge model, the result from another experiment with a spheroidal bulge is shown in the lower panel. The bi-modality distribution is still clear in this second experiment.
Current usage metrics show cumulative count of Article Views (full-text article views including HTML views, PDF and ePub downloads, according to the available data) and Abstracts Views on Vision4Press platform.
Data correspond to usage on the plateform after 2015. The current usage metrics is available 48-96 hours after online publication and is updated daily on week days.
Initial download of the metrics may take a while.