Fig. 8
Download original image
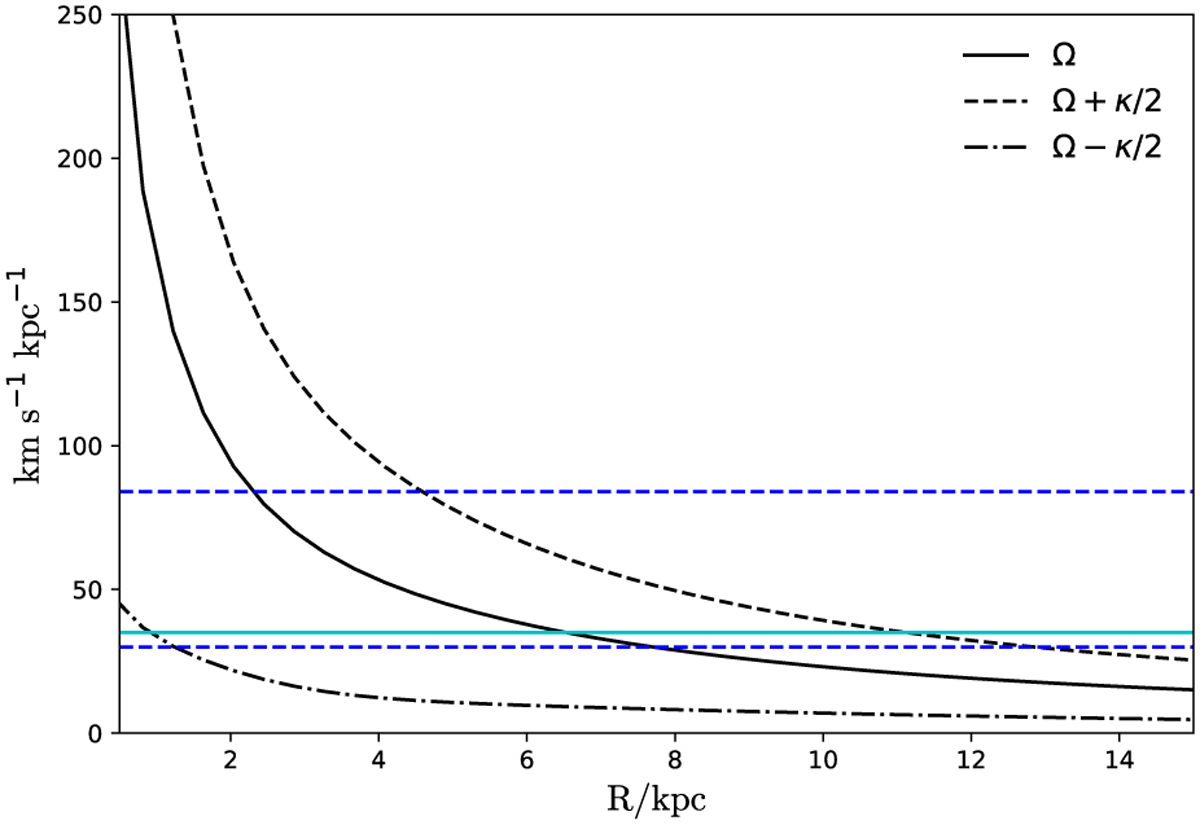
Frequency of Ω ± κ/2 derived from the background potential as a function of planar radius. The solid cyan line denotes to the bar’s pattern speed used in the constant rotating bar model. The co-rotation radius is defined as the planar radius at the intersection between the frequency curve and the pattern speed curve. The dashed blue lines mark the initial and final pattern speed in the decelerating bar model, which shows the change of co-rotation radius during 6 Gyrs. The stars trapped by the bar thus migrate outwards with time until the pattern speed reaches a stable value and the co-rotation radius stops increasing.
Current usage metrics show cumulative count of Article Views (full-text article views including HTML views, PDF and ePub downloads, according to the available data) and Abstracts Views on Vision4Press platform.
Data correspond to usage on the plateform after 2015. The current usage metrics is available 48-96 hours after online publication and is updated daily on week days.
Initial download of the metrics may take a while.