Fig. 4
Download original image
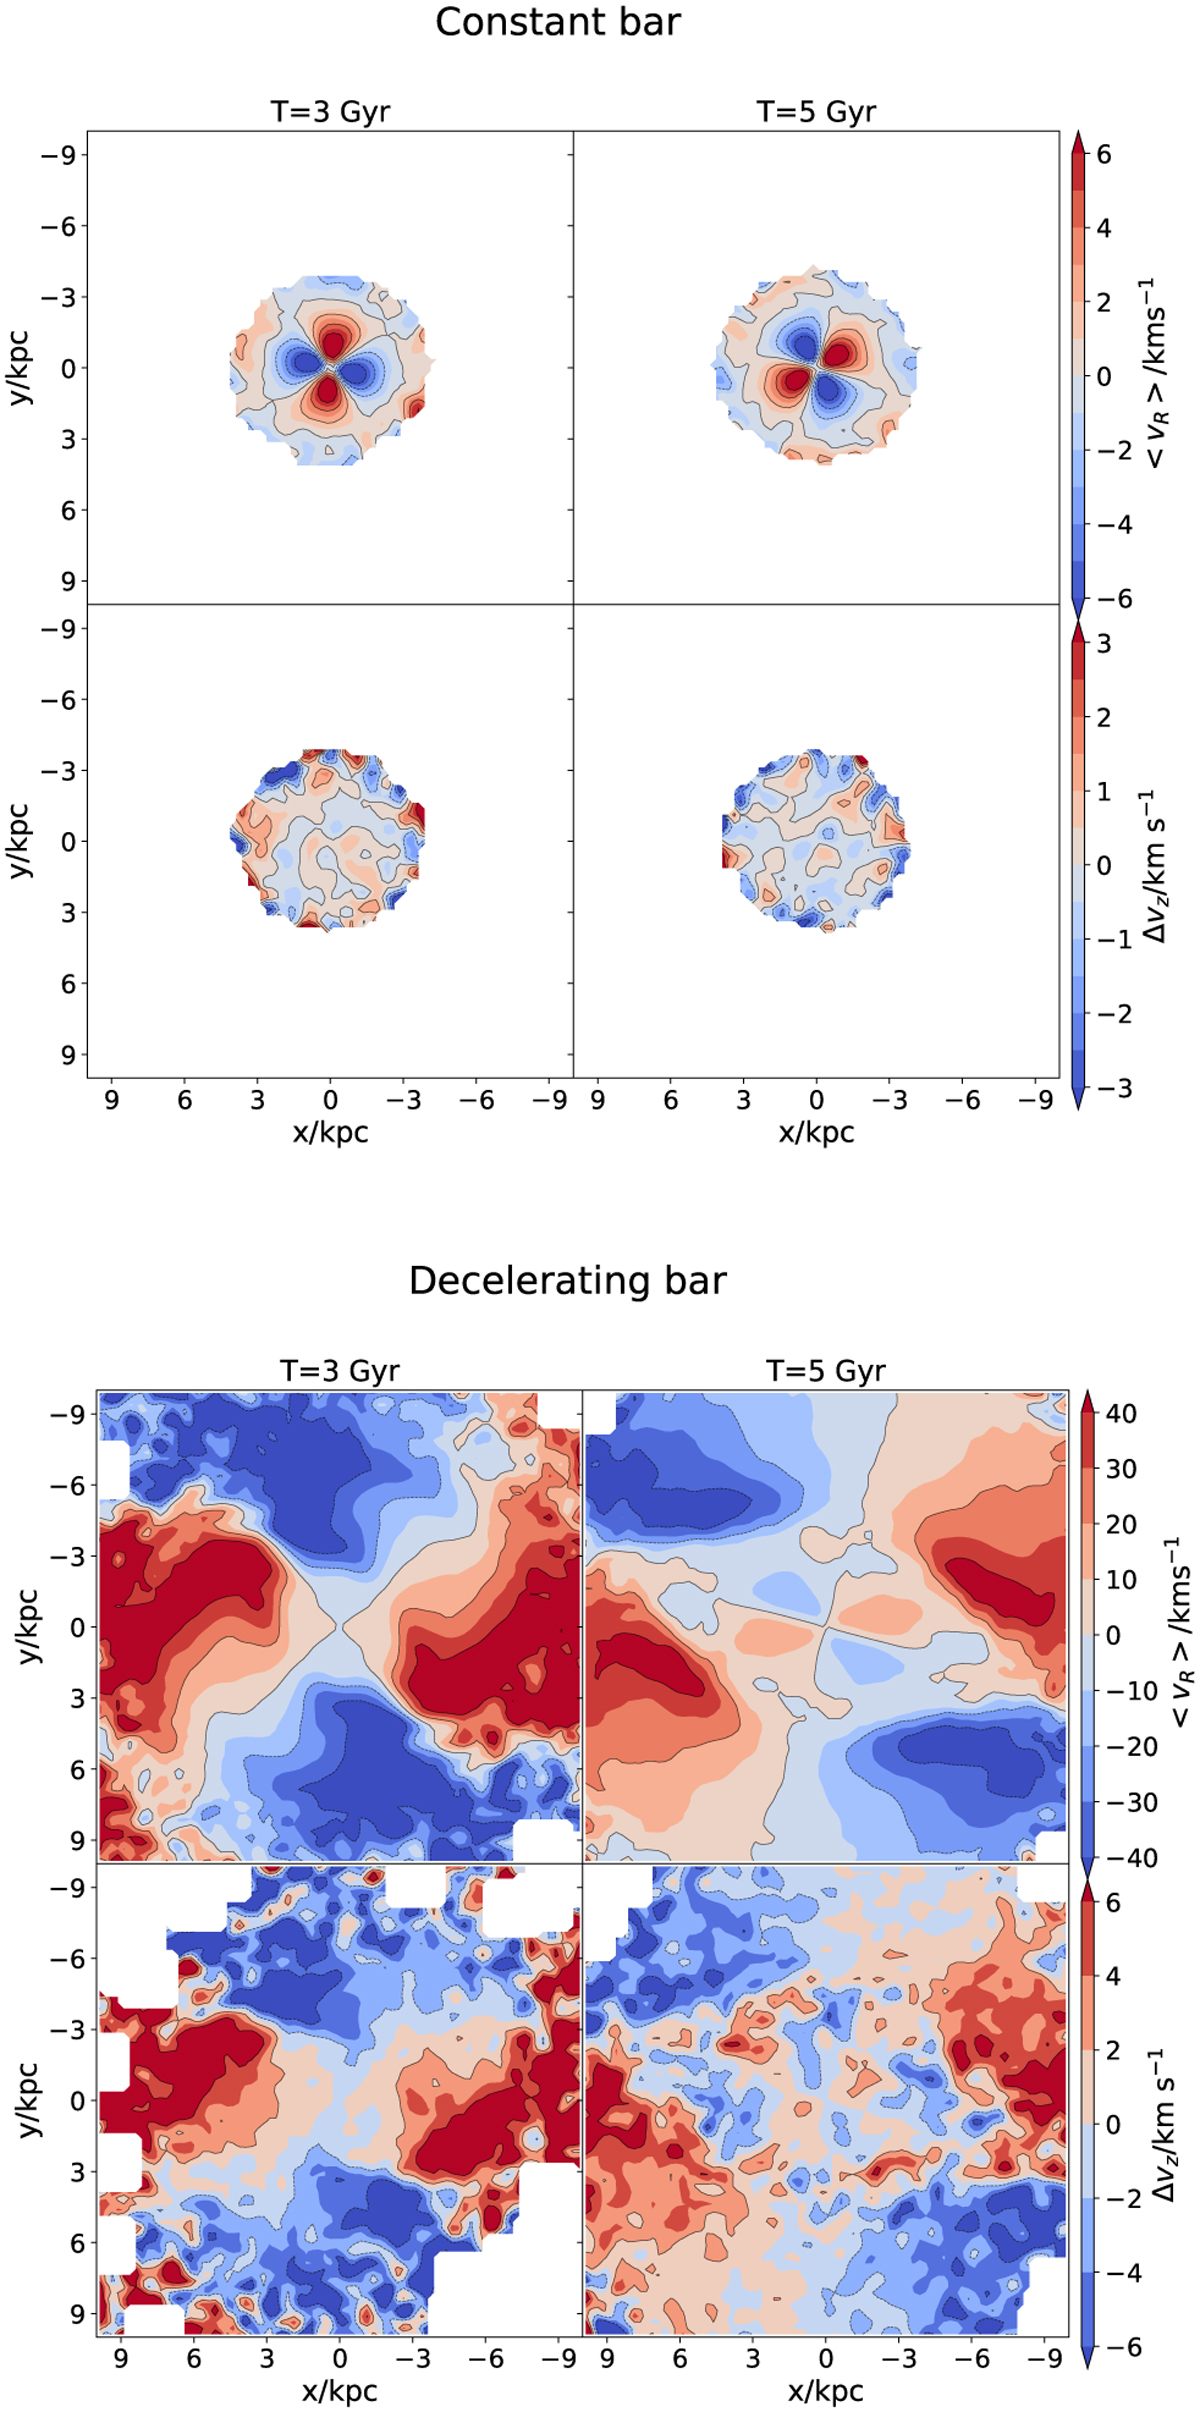
Contours of ⟨vR⟩ and ![]() for constant bar and decelerating bar respectively at T = 3.0 Gyr and T = 5.0 Gyr. The upper panel shows the contour maps for constant bar model, which is Gaussian smoothed with a filter width of 4Δpix, with Δpix = 0.25 × 0.25 (kpc × kpc). The lower panel shows the same contour map for decelerating bar model, but is Gaussian smoothed with a filter width of 8 Δpix. The difference of choice in the filter width is due to the different spatial distribution of the test particles in the two simulations. The ⟨vR⟩ values are several times larger than that of the constant pattern speed bar model, which suggests that the decelerating bar can generate very strong quadruple features for all the pseudo stars including those with high orbital inclinations.
for constant bar and decelerating bar respectively at T = 3.0 Gyr and T = 5.0 Gyr. The upper panel shows the contour maps for constant bar model, which is Gaussian smoothed with a filter width of 4Δpix, with Δpix = 0.25 × 0.25 (kpc × kpc). The lower panel shows the same contour map for decelerating bar model, but is Gaussian smoothed with a filter width of 8 Δpix. The difference of choice in the filter width is due to the different spatial distribution of the test particles in the two simulations. The ⟨vR⟩ values are several times larger than that of the constant pattern speed bar model, which suggests that the decelerating bar can generate very strong quadruple features for all the pseudo stars including those with high orbital inclinations.
Current usage metrics show cumulative count of Article Views (full-text article views including HTML views, PDF and ePub downloads, according to the available data) and Abstracts Views on Vision4Press platform.
Data correspond to usage on the plateform after 2015. The current usage metrics is available 48-96 hours after online publication and is updated daily on week days.
Initial download of the metrics may take a while.