Open Access
Fig. 3
Download original image
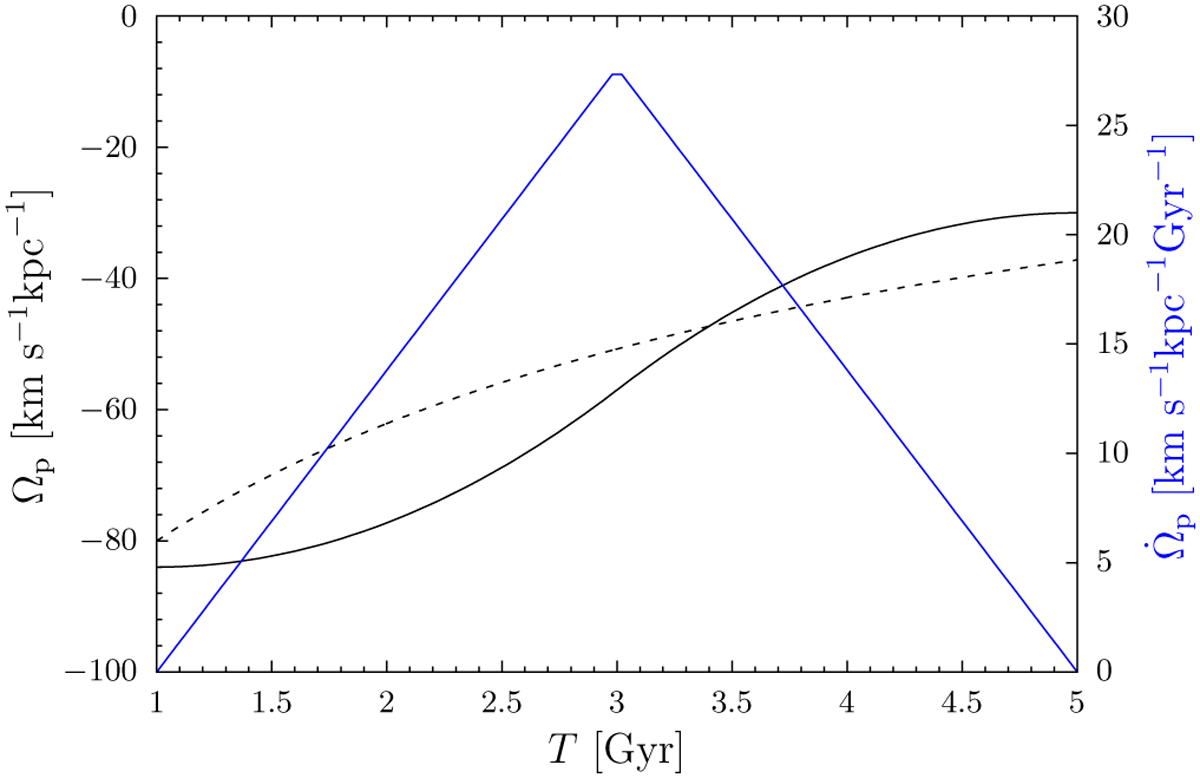
Pattern speed as a function of time is shown in solid black line. The blue curve shows the derivative of the pattern speed. For comparison, the model from Chiba et al. (2021) is shown as a black dashed curve.
Current usage metrics show cumulative count of Article Views (full-text article views including HTML views, PDF and ePub downloads, according to the available data) and Abstracts Views on Vision4Press platform.
Data correspond to usage on the plateform after 2015. The current usage metrics is available 48-96 hours after online publication and is updated daily on week days.
Initial download of the metrics may take a while.