Fig. 1
Download original image
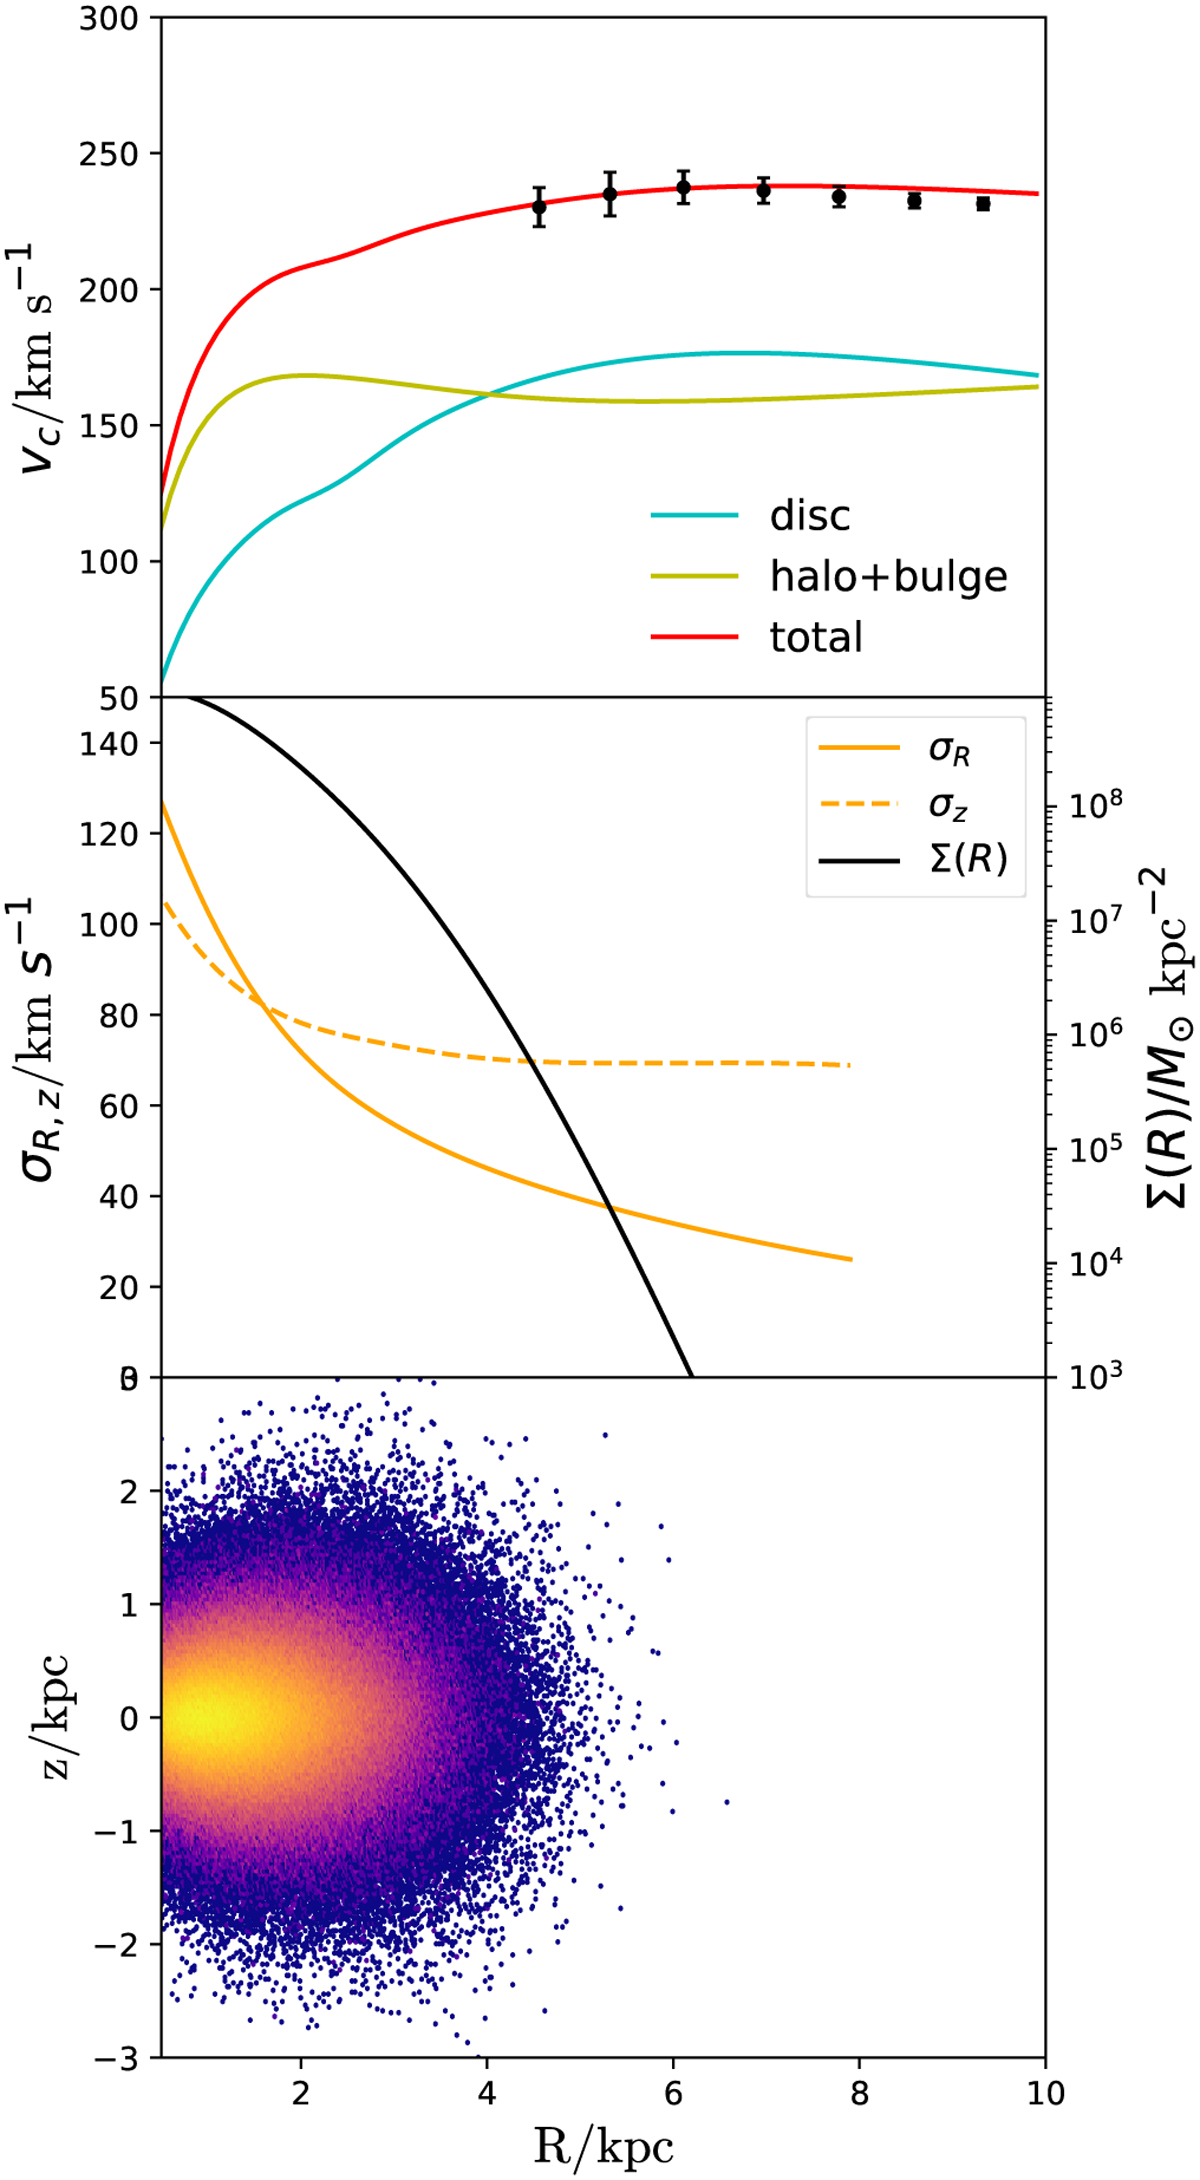
Circular velocity within 10 kpc from the Galactic centre (upper panel), where the yellow curve represents the sum from the bulge and halo. The red curve denotes all four disc components. The black dots are from Ablimit et al. (2020) with the measurement from classical Cepheids. The velocity dispersion and surface density of the bulge are shown in the middle panel. The radial velocity dispersion σR drops much rapidly relative to the vertical velocity dispersion σz. The bottom panel shows the spatial distribution of the pseudo-stars in the (R, z) space for the bulge sample. The bulge is truncated within 6 kpc from the centre and has a peanut-like shape instead of a sphere.
Current usage metrics show cumulative count of Article Views (full-text article views including HTML views, PDF and ePub downloads, according to the available data) and Abstracts Views on Vision4Press platform.
Data correspond to usage on the plateform after 2015. The current usage metrics is available 48-96 hours after online publication and is updated daily on week days.
Initial download of the metrics may take a while.