Fig. C.1.
Download original image
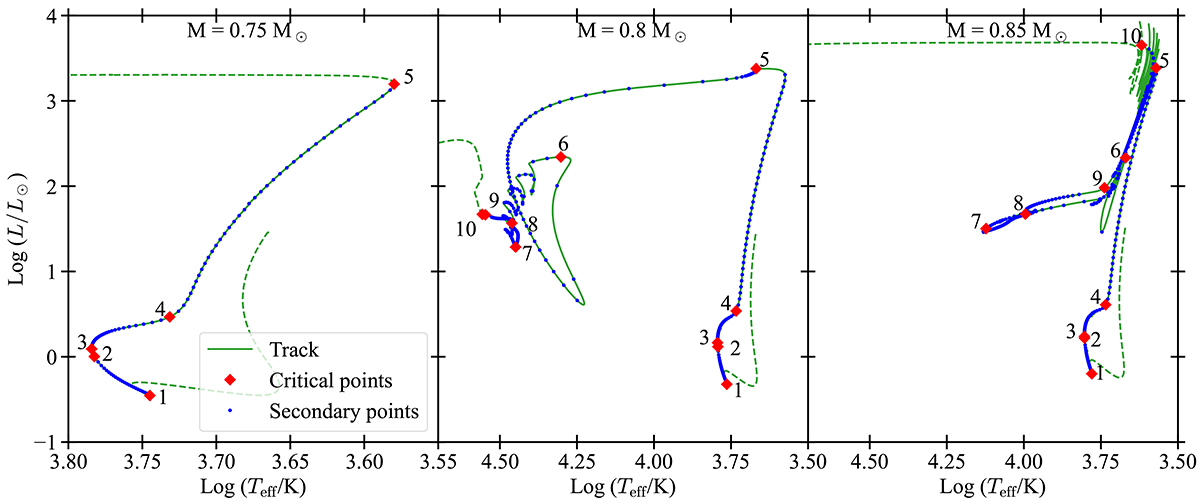
HR diagram of selected tracks with 0.75, 0.8, and 0.85 M⊙ in the left-hand, middle, and right-hand panels, respectively. The tracks are computed with Z = 0.002 and Y = 0.249. The continuous lines show the evolutionary phases we include in the isochrones computation, while dashed lines indicate the pre-MS and the planetary nebula phases (excluded from the computations). Red diamonds and blue circles show the critical points (marked by a number) and the secondary interpolated points, respectively
Current usage metrics show cumulative count of Article Views (full-text article views including HTML views, PDF and ePub downloads, according to the available data) and Abstracts Views on Vision4Press platform.
Data correspond to usage on the plateform after 2015. The current usage metrics is available 48-96 hours after online publication and is updated daily on week days.
Initial download of the metrics may take a while.