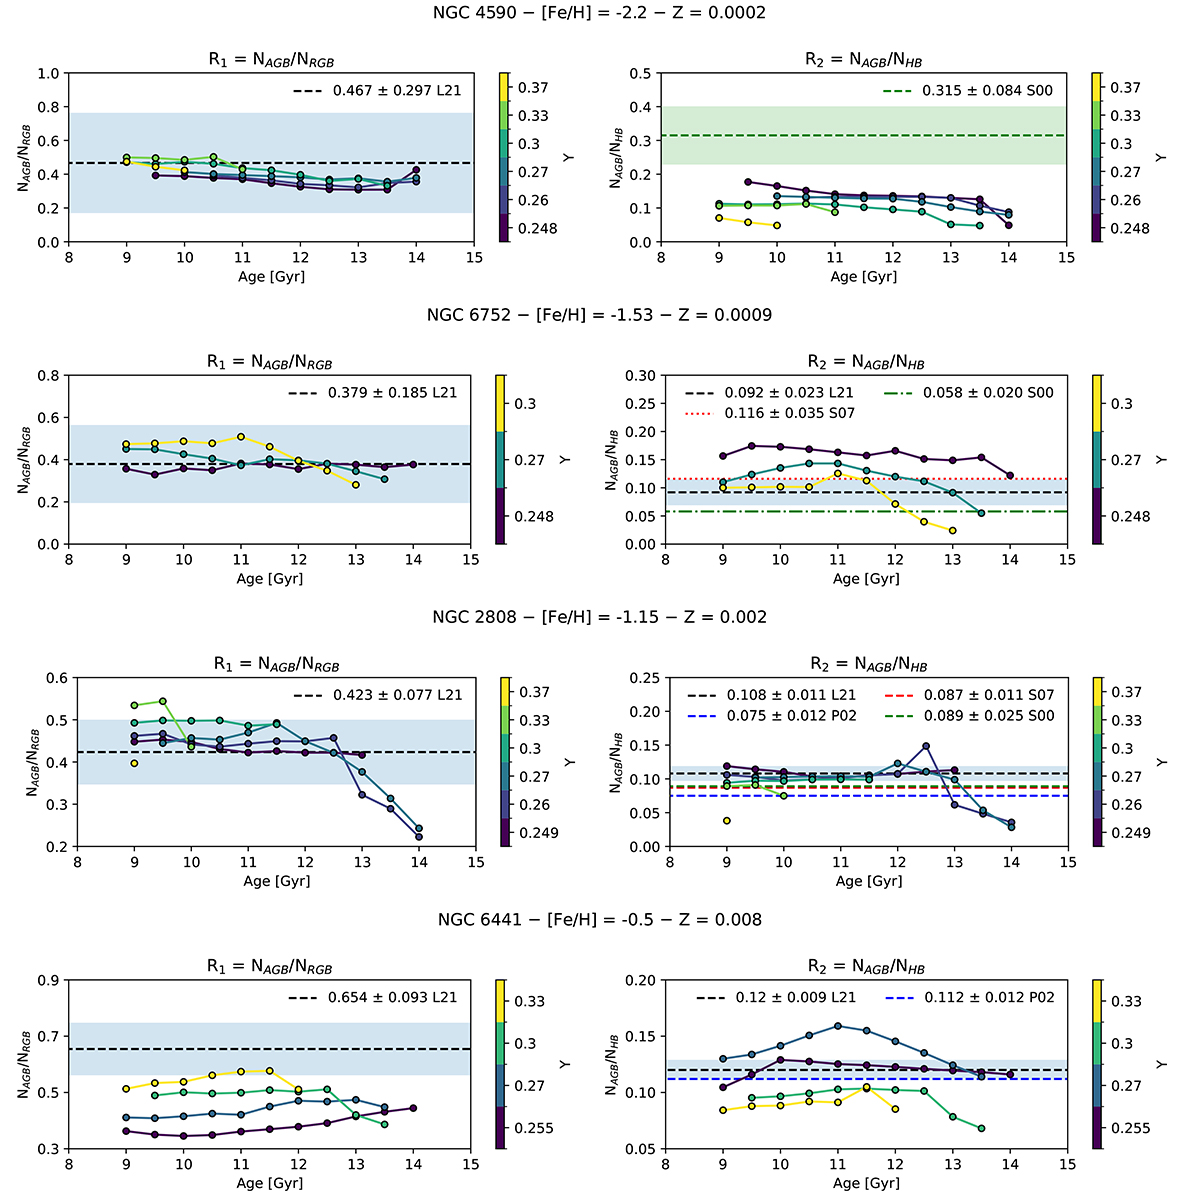
Fig. 6.
Download original image
Number ratios versus age, for different initial He content (in different colors). The left column shows R1, while the right column shows R2. Each row indicates the ratios for different initial metallicity (i.e., for different clusters). The dashed horizontal black lines indicate the number ratios for each cluster obtained by Lagioia et al. (2021, L21) from observations. The corresponding 1σ statistical Poisson error is indicated by the blue horizontal area. The dashed blue and red lines indicate R2 results by Constantino et al. (2016), which used data from Piotto et al. (2002, P02) and Sarajedini et al. (2007, S07), respectively. The dashed green line shows values from the collection by Sandquist (2000, S00). The green area in the upper-right panel shows the error associated with the Sandquist (2000) value of the ratio. For clarity purposes, we do not show the statistical errors of all observed values in the other panels, but only those by Lagioia et al. (2021). The other errors have amplitudes similar to those shown here
Current usage metrics show cumulative count of Article Views (full-text article views including HTML views, PDF and ePub downloads, according to the available data) and Abstracts Views on Vision4Press platform.
Data correspond to usage on the plateform after 2015. The current usage metrics is available 48-96 hours after online publication and is updated daily on week days.
Initial download of the metrics may take a while.