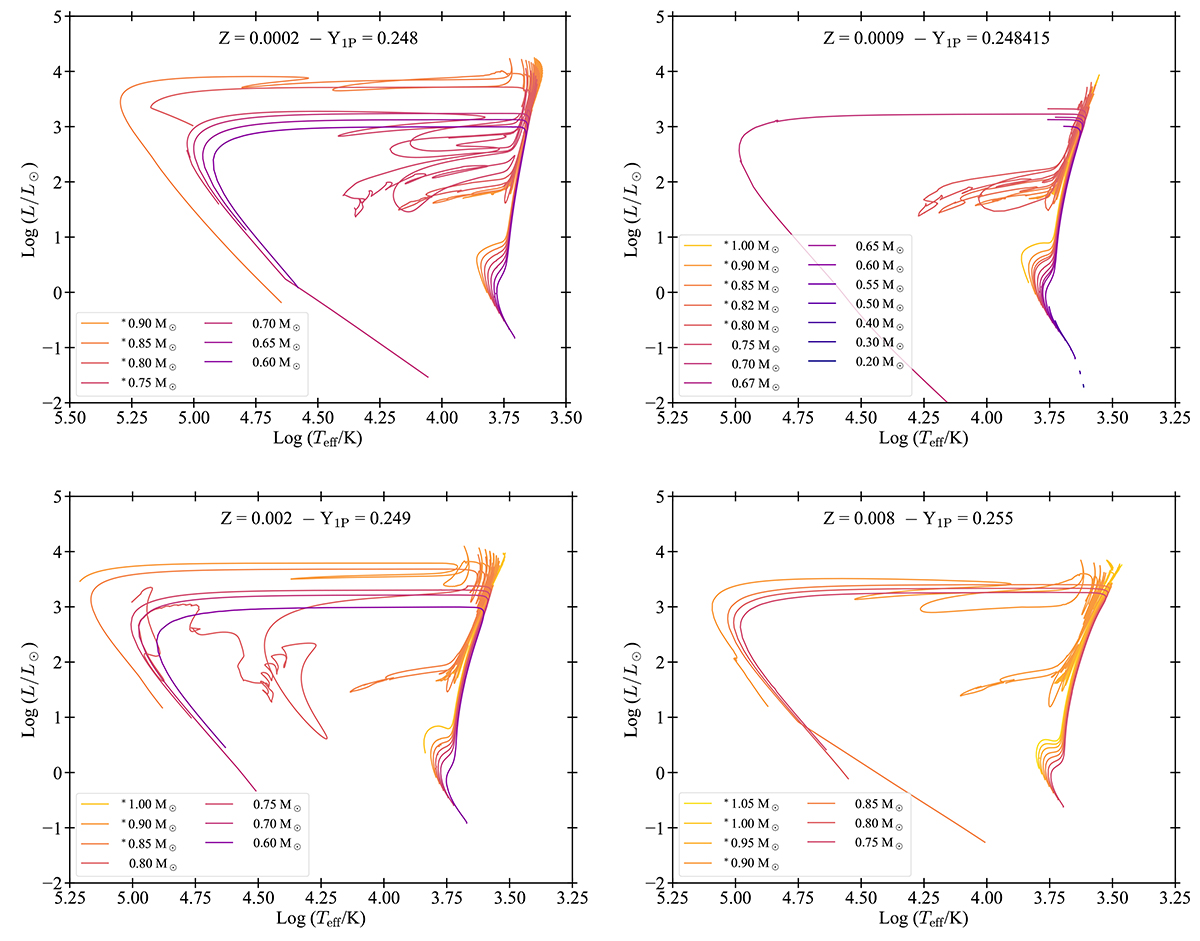
Fig. 2.
Download original image
Selected evolutionary tracks of STAREVOL in the HR diagram, representing 1P stars of the four clusters listed in Table 1. Starting from the top-left and going clockwise, tracks are computed with Z = 0.0002, 0.0009, 0.008, and 0.002. Different colors indicate different initial masses. Tracks are shown from their ZAMS to the planetary nebula phase and WD cooling. The little star apex in the label before the masses indicates stars that go to the AGB phase
Current usage metrics show cumulative count of Article Views (full-text article views including HTML views, PDF and ePub downloads, according to the available data) and Abstracts Views on Vision4Press platform.
Data correspond to usage on the plateform after 2015. The current usage metrics is available 48-96 hours after online publication and is updated daily on week days.
Initial download of the metrics may take a while.