Fig. C.3.
Download original image
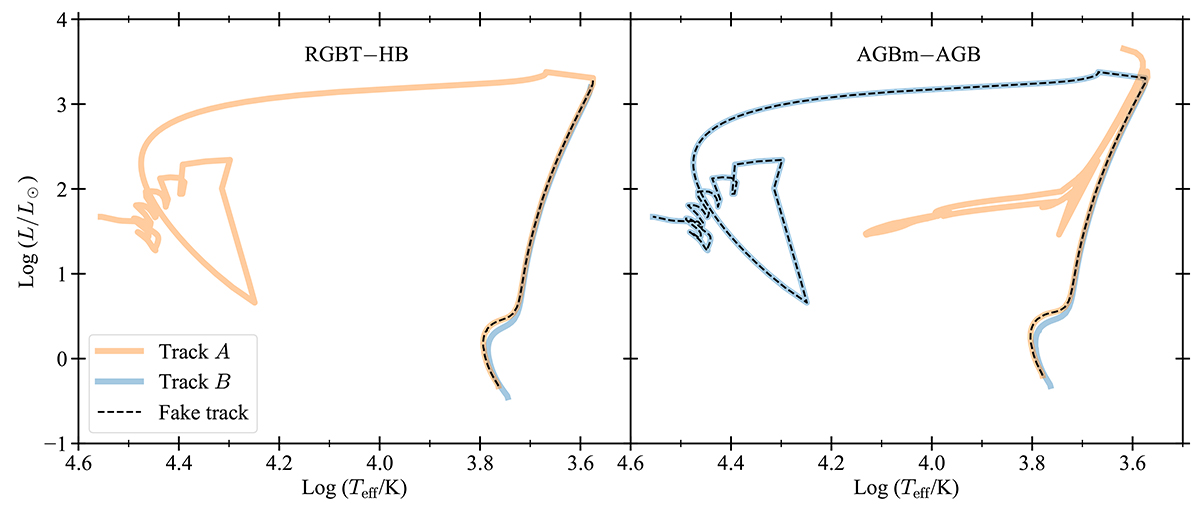
Two examples of fake tracks (dashed black lines) created to avoid the interpolation between tracks with different evolutionary paths. The orange line shows the track with the mass above the transition (track A), and the blue line indicates the track with the mass below the transition (track B). The left-hand panel shows the fake track created for the transition RGBT-HB (enclosed by tracks with 0.75 and 0.8 M⊙), while the right-hand panel shows the fake track for the AGBm-AGB transition (enclosed by tracks with 0.8 and 0.85 M⊙). All the tracks are computed with Z = 0.002 and Y = 0.249. See details on the fake track creations in the text
Current usage metrics show cumulative count of Article Views (full-text article views including HTML views, PDF and ePub downloads, according to the available data) and Abstracts Views on Vision4Press platform.
Data correspond to usage on the plateform after 2015. The current usage metrics is available 48-96 hours after online publication and is updated daily on week days.
Initial download of the metrics may take a while.