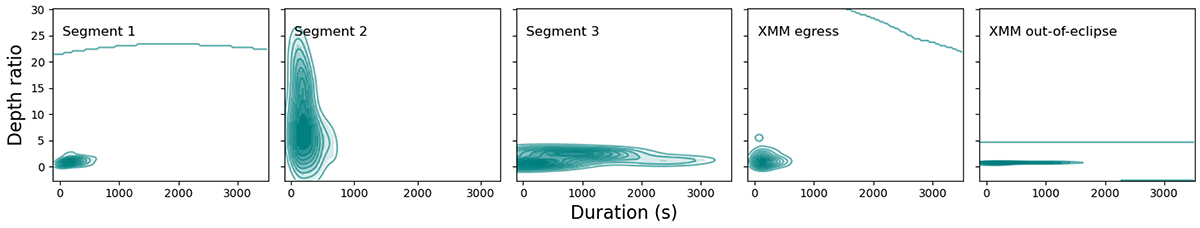
Fig. 6.
Download original image
Kernel density estimation (KDE) plots depicting the relationship between ‘Depth Ratio’ (low energy depth divided by high energy depth) and dip duration in various observations. The panels showcase results from distinct datasets. From left to right: Chandra segments 1, 2 and 3, XMM high-soft observation and XMM low-hard observation results. Solid lines within each panel represent KDE contour levels, demarcating regions of equal density in the estimated distribution.
Current usage metrics show cumulative count of Article Views (full-text article views including HTML views, PDF and ePub downloads, according to the available data) and Abstracts Views on Vision4Press platform.
Data correspond to usage on the plateform after 2015. The current usage metrics is available 48-96 hours after online publication and is updated daily on week days.
Initial download of the metrics may take a while.