Fig. 5.
Download original image
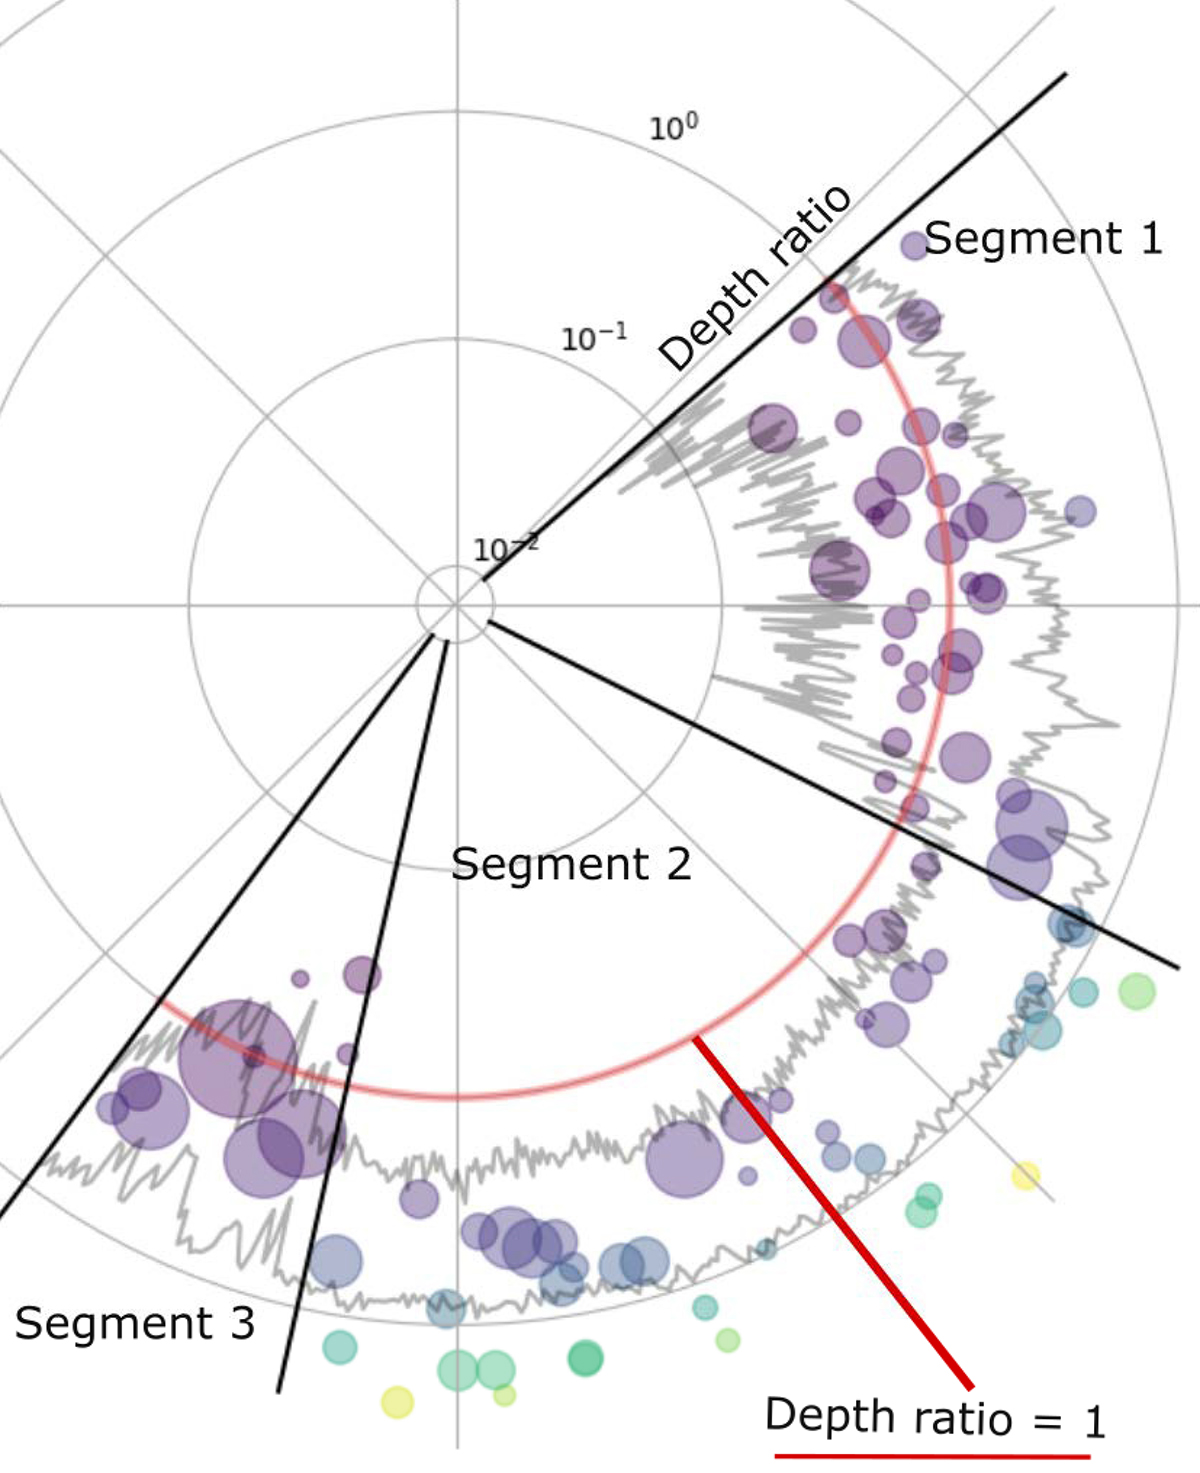
Dips detected during this observation. The radial Y axis represents the depth ratio while the dot size is proportional to the dip duration. The color gradient from blue to yellow in a crescent pattern serves to accentuate the relative depth of each dip. A depth ratio higher than one is indicative of absorption (clump signatures) while depth ratio equal or smaller than one is indicative of intrinsic decrease of the flux. Note the logarithmic scale in the radial y axis.
Current usage metrics show cumulative count of Article Views (full-text article views including HTML views, PDF and ePub downloads, according to the available data) and Abstracts Views on Vision4Press platform.
Data correspond to usage on the plateform after 2015. The current usage metrics is available 48-96 hours after online publication and is updated daily on week days.
Initial download of the metrics may take a while.