Open Access
Fig. 10.
Download original image
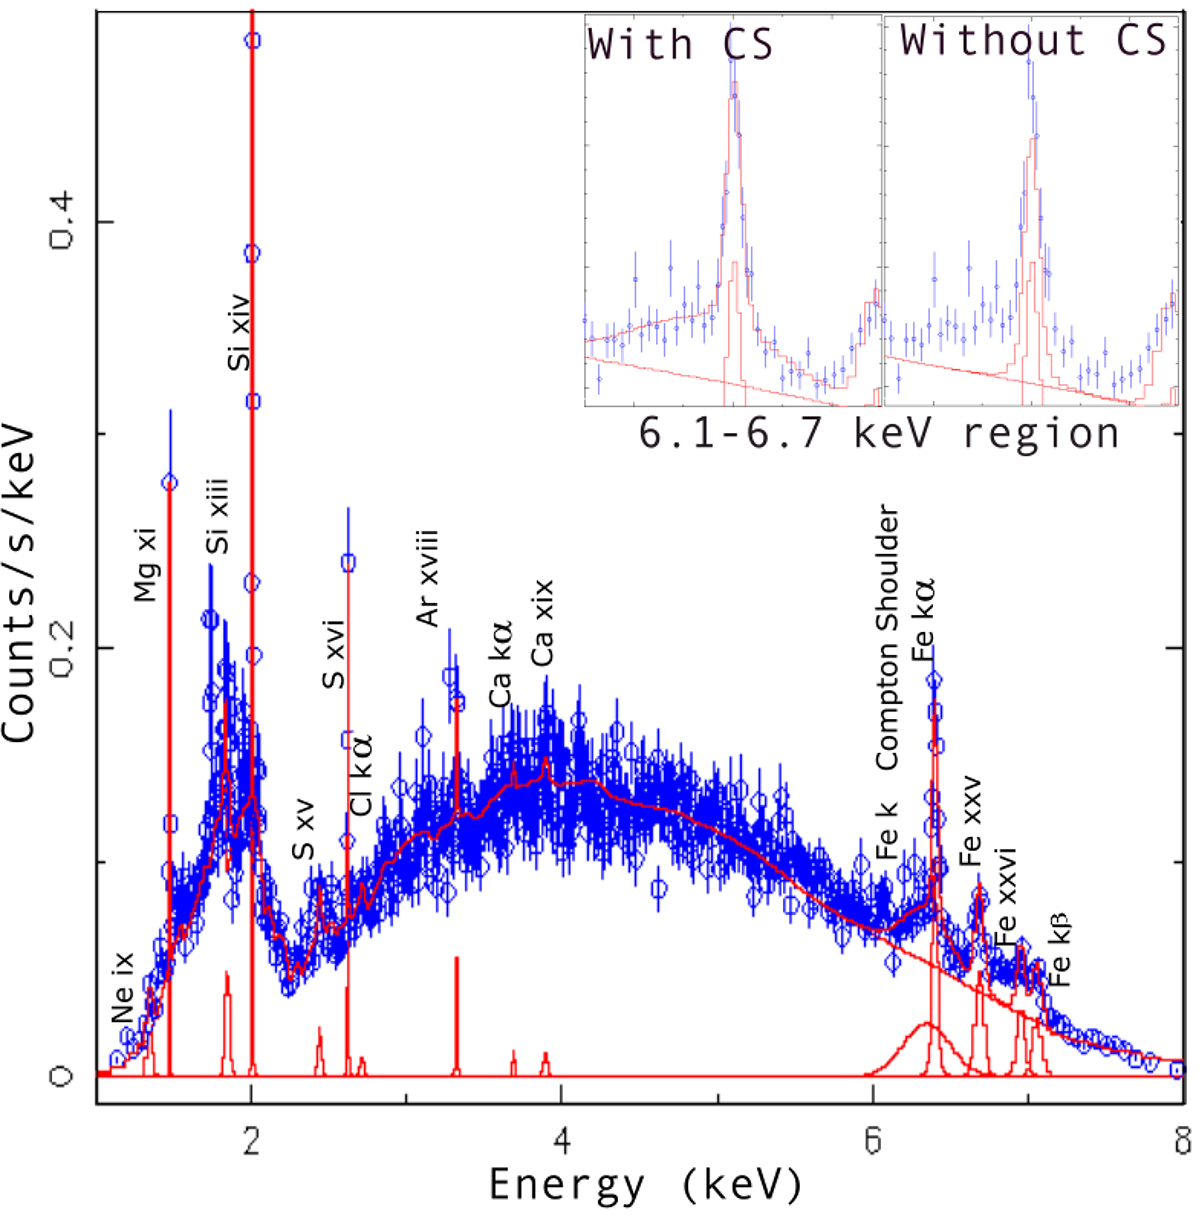
Segment 1-a spectra (blue) plus the model (red) and emission lines detected within this observation. Two inserts in the top right of the figure represent the Fe Kα region, with and without the Compton shoulder component added to the model.
Current usage metrics show cumulative count of Article Views (full-text article views including HTML views, PDF and ePub downloads, according to the available data) and Abstracts Views on Vision4Press platform.
Data correspond to usage on the plateform after 2015. The current usage metrics is available 48-96 hours after online publication and is updated daily on week days.
Initial download of the metrics may take a while.