Fig. 1.

Download original image
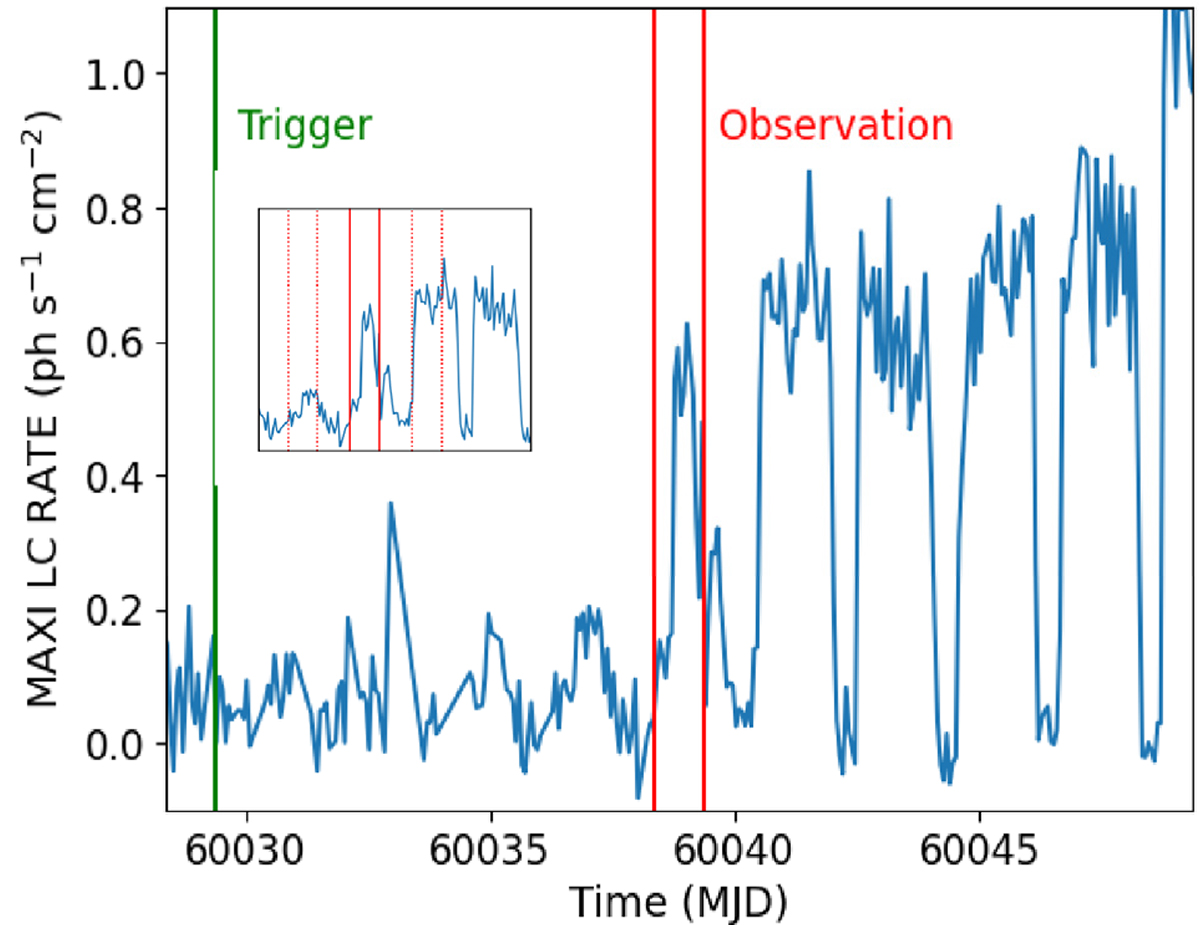
Long-term Cen X-3 MAXI light curve. The green vertical line represents the trigger, that is, the moment when our ML algorithm gave us a signal with a high probability of a long low state. The observation between the two red solid lines was made 9 d later, coinciding with the start of the source’s state change. The inset is an enlargement of our observation (marked between two red solid lines) and the same phases one orbit before and after (marked between two red dashed lines). The light curve shown in Fig. 2 corresponds to the part of this light curve between the two red solid lines. Note that the MAXI light curve covers the 2 − 20 keV energy range, while the light curves shown in Fig. 2 cover the 0.2 − 3 (green) and 3 − 10 (red) keV energy ranges, respectively, and are presented in polar coordinates.
Current usage metrics show cumulative count of Article Views (full-text article views including HTML views, PDF and ePub downloads, according to the available data) and Abstracts Views on Vision4Press platform.
Data correspond to usage on the plateform after 2015. The current usage metrics is available 48-96 hours after online publication and is updated daily on week days.
Initial download of the metrics may take a while.


