Fig. 8
Download original image
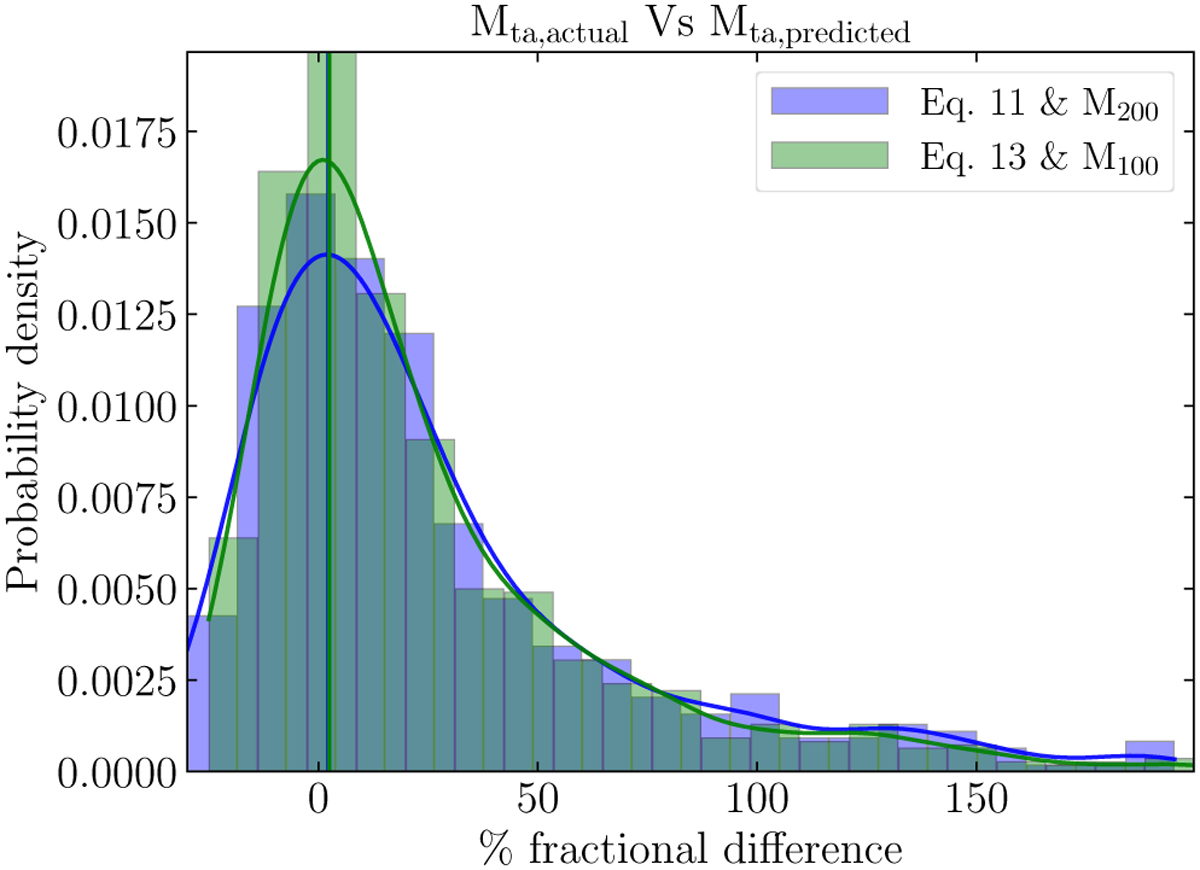
Comparison between the scaling relations delineated in Eqs. (13) and (11). The blue histogram depicted herein corresponds to that of the left panel in Fig. 5. Superimposed on this histogram is the fractional difference between the actual value of Mta (X = 11) and its predicted counterpart assuming a prior knowledge of M100 (that is, if we set Y = 100).
Current usage metrics show cumulative count of Article Views (full-text article views including HTML views, PDF and ePub downloads, according to the available data) and Abstracts Views on Vision4Press platform.
Data correspond to usage on the plateform after 2015. The current usage metrics is available 48-96 hours after online publication and is updated daily on week days.
Initial download of the metrics may take a while.