Fig. 5
Download original image
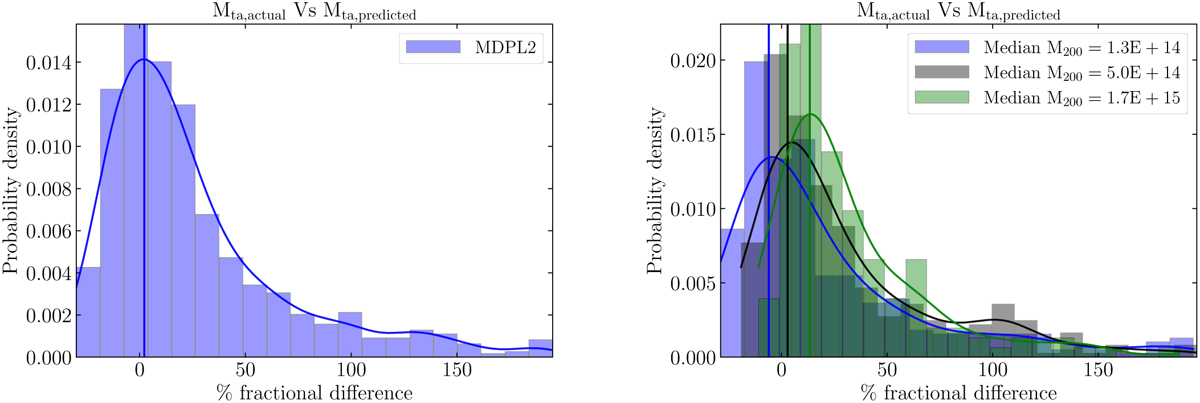
Probability density of the fractional (percentage) difference between the turnaround mass (here M11) predicted from the scaling relation of Eq. (11) and its actual value, for the full MDPL2 simulated cluster sample at z = 0 (left panel), and for halo subsamples of different median M200 (right panel). In each case, the solid line shows a Gaussian kernel estimator of the probability density function, and the vertical line marks the mode of the error distribution. The scaling relation tends to overpredict M11 for lower M200 and underpredict it for higher M200.
Current usage metrics show cumulative count of Article Views (full-text article views including HTML views, PDF and ePub downloads, according to the available data) and Abstracts Views on Vision4Press platform.
Data correspond to usage on the plateform after 2015. The current usage metrics is available 48-96 hours after online publication and is updated daily on week days.
Initial download of the metrics may take a while.