Fig. 2
Download original image
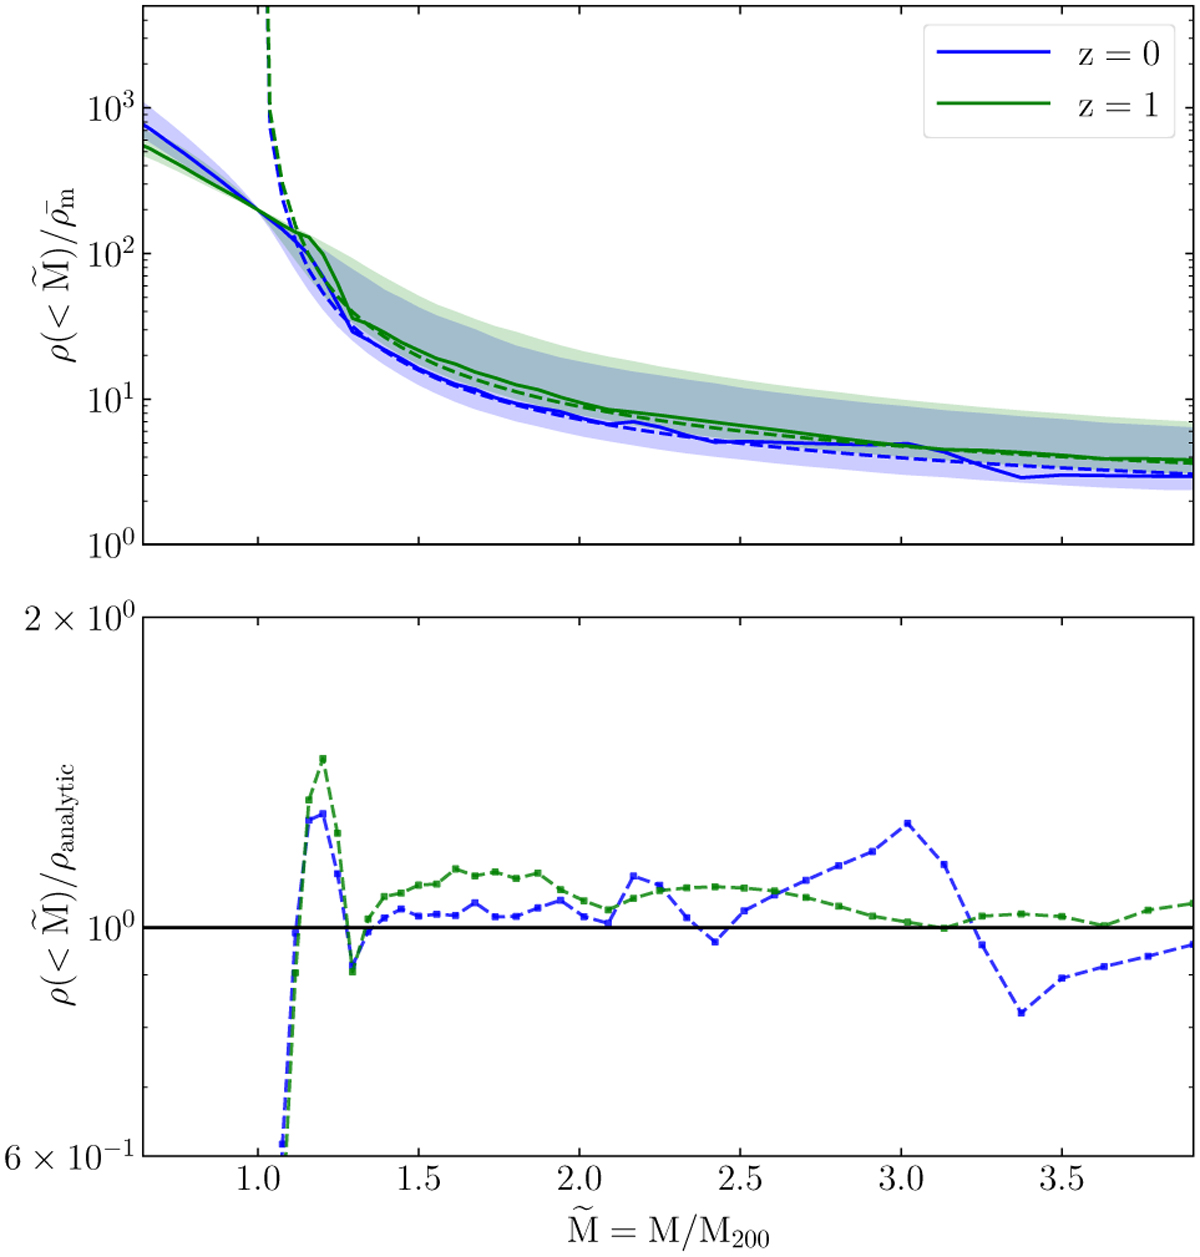
Performance of our analytic density profile for different redshifts. Upper panel: most probable (mode) average matter density within spheres of enclosed mass M as a function of M (normalized to M200; ![]() is equivalent to β in Eq. (8)), from our analytic result (Eq. (8), dashed lines), and from the MDPL2 simulation halos (solid lines; the shaded region includes 68% of the densities PDF), for z = 0 (blue) and z = 1 (green). Lower panel: ratio of MDPL2 over analytic mode profile as a function of enclosed mass. In the bottom panel, the ratio of the mode to the analytic profiles is displayed.
is equivalent to β in Eq. (8)), from our analytic result (Eq. (8), dashed lines), and from the MDPL2 simulation halos (solid lines; the shaded region includes 68% of the densities PDF), for z = 0 (blue) and z = 1 (green). Lower panel: ratio of MDPL2 over analytic mode profile as a function of enclosed mass. In the bottom panel, the ratio of the mode to the analytic profiles is displayed.
Current usage metrics show cumulative count of Article Views (full-text article views including HTML views, PDF and ePub downloads, according to the available data) and Abstracts Views on Vision4Press platform.
Data correspond to usage on the plateform after 2015. The current usage metrics is available 48-96 hours after online publication and is updated daily on week days.
Initial download of the metrics may take a while.