Fig. B.1.
Download original image
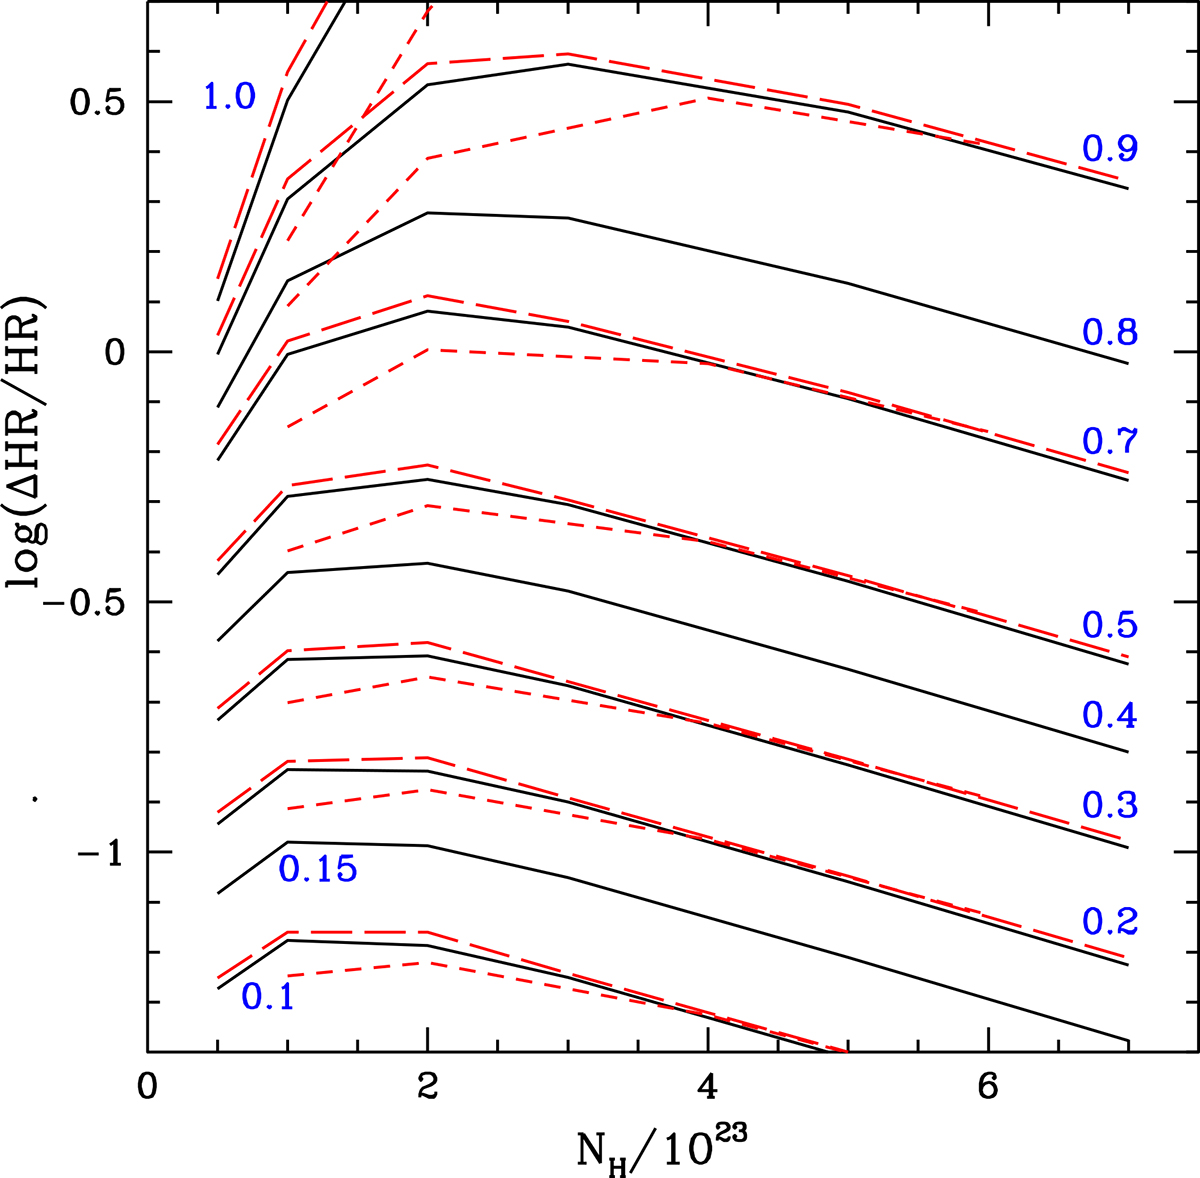
Fractional variation of hardness ratio as a function of NHX for fixed values of the covering factor, CF. Blue labels specify the value of CF for which each group of curves is obtained. For each CF value chosen, solid black curves represent the results of Suzaku-XIS simulations for type-1 sources, whereas the long-dashed red ones show those derived for type-1 with XMM-Newton-EPIC/PN. When present, the third short-dashed red line of each CF-value group of curves represents the case for type-2 XMM simulations.
Current usage metrics show cumulative count of Article Views (full-text article views including HTML views, PDF and ePub downloads, according to the available data) and Abstracts Views on Vision4Press platform.
Data correspond to usage on the plateform after 2015. The current usage metrics is available 48-96 hours after online publication and is updated daily on week days.
Initial download of the metrics may take a while.