Fig. 3.
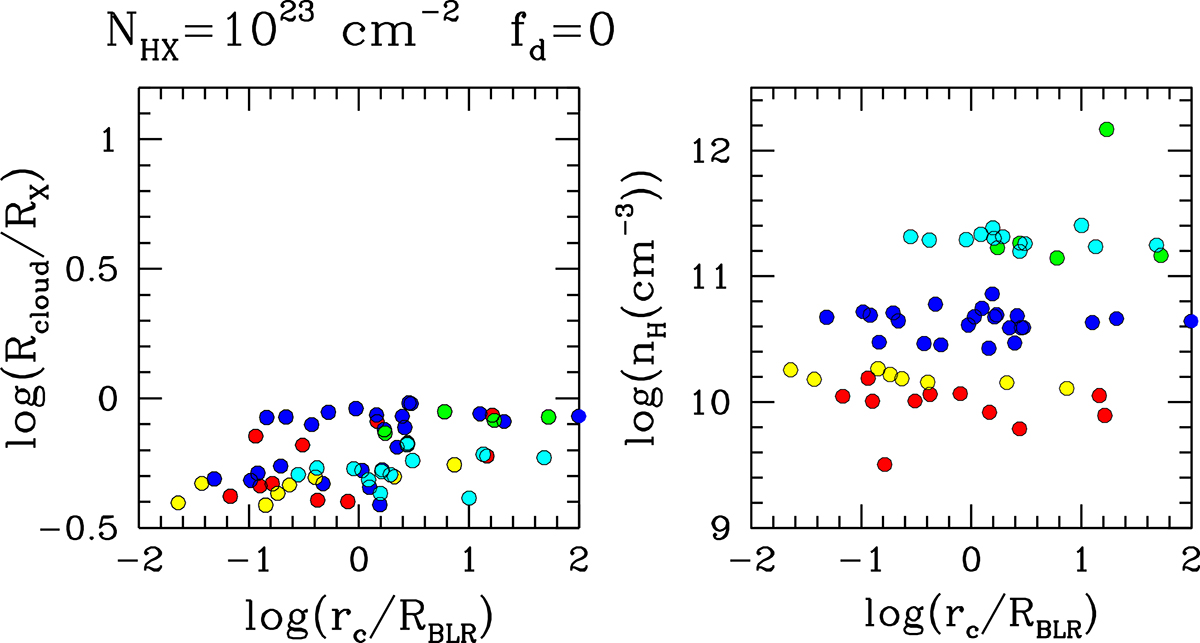
Download original image
Best match solutions obtained for our detected events in the case of central geometry. Yellow dots represent best matches for NGC 3783 detected eclipse events, cyan dots show best matches for those of MCG 06-30-15, green dots show matches obtained for events referring to all other sources with MBH < 6.5, red dots are for all other sources with MBH > 7, and finally blue dots are best match events referring to intermediate mass sources with 6.5 < MBH < 7, where MBH ≡ log(MBH/M⊙).
Current usage metrics show cumulative count of Article Views (full-text article views including HTML views, PDF and ePub downloads, according to the available data) and Abstracts Views on Vision4Press platform.
Data correspond to usage on the plateform after 2015. The current usage metrics is available 48-96 hours after online publication and is updated daily on week days.
Initial download of the metrics may take a while.