Fig. 2.
Download original image
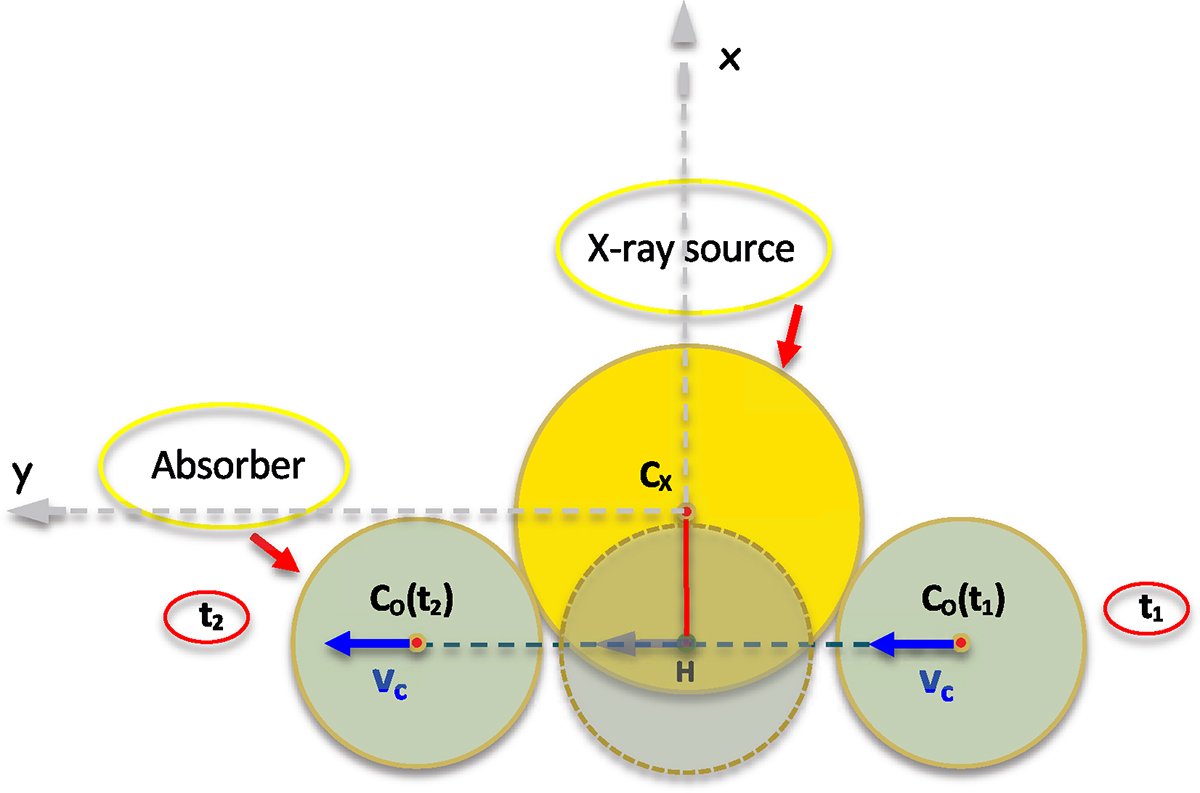
Schematic illustration of an eclipse event as seen on the sky plane from the observer line of sight (z-direction, normal to the page). The distance, HCX ≡ d, between the source centre, CX, and the straight line trajectory of the absorber projection centre, C0, during the eclipse, represents a sort of ‘impact parameter’, d, for the occultation and is depicted in red.
Current usage metrics show cumulative count of Article Views (full-text article views including HTML views, PDF and ePub downloads, according to the available data) and Abstracts Views on Vision4Press platform.
Data correspond to usage on the plateform after 2015. The current usage metrics is available 48-96 hours after online publication and is updated daily on week days.
Initial download of the metrics may take a while.