Fig. C.1.
Download original image
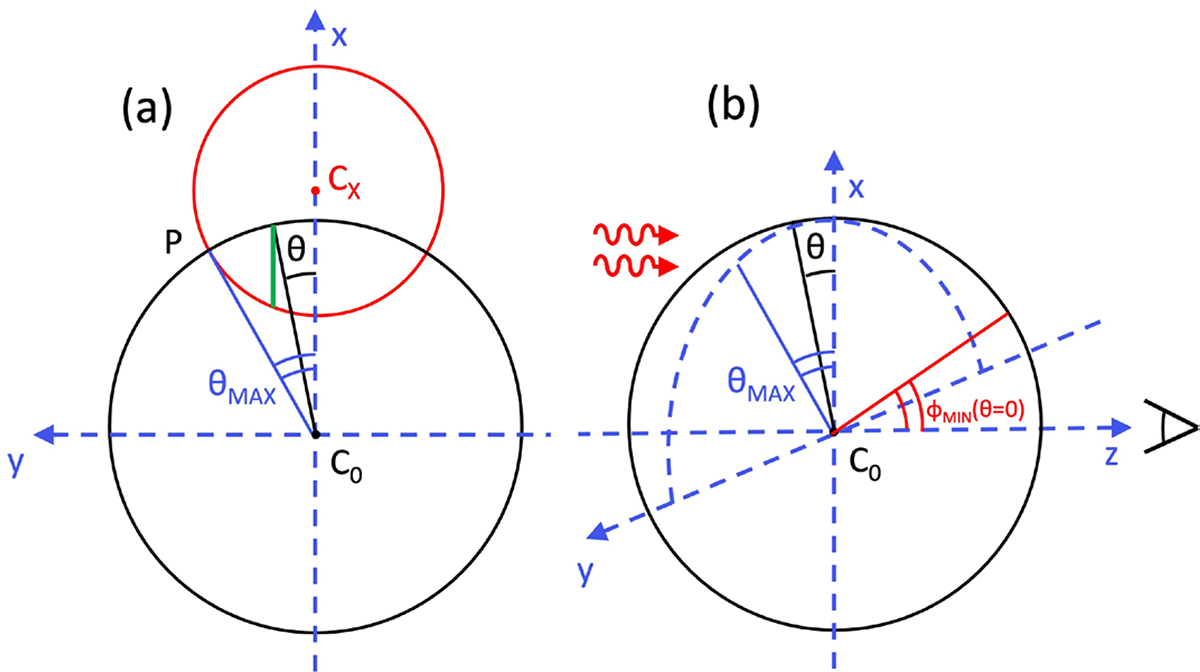
Schematic representation of the maximum coverage condition for an exemplifying case of non-central occultation geometry; here ![]() . Panel (a) shows in red the projection on the {x, y} sky plane of the X-ray source, whose centre is
. Panel (a) shows in red the projection on the {x, y} sky plane of the X-ray source, whose centre is ![]() , whereas the projection of the occulting cloud is in black, with centre in C0. In panel (b) the same configuration is seen from a different perspective, in which the line of sight to the observer is shown as the z-axis direction, along which X-ray photons are coming from the X-ray source from the left. See the main text for the meaning of other notation.
, whereas the projection of the occulting cloud is in black, with centre in C0. In panel (b) the same configuration is seen from a different perspective, in which the line of sight to the observer is shown as the z-axis direction, along which X-ray photons are coming from the X-ray source from the left. See the main text for the meaning of other notation.
Current usage metrics show cumulative count of Article Views (full-text article views including HTML views, PDF and ePub downloads, according to the available data) and Abstracts Views on Vision4Press platform.
Data correspond to usage on the plateform after 2015. The current usage metrics is available 48-96 hours after online publication and is updated daily on week days.
Initial download of the metrics may take a while.