Open Access
Fig. B.3.
Download original image
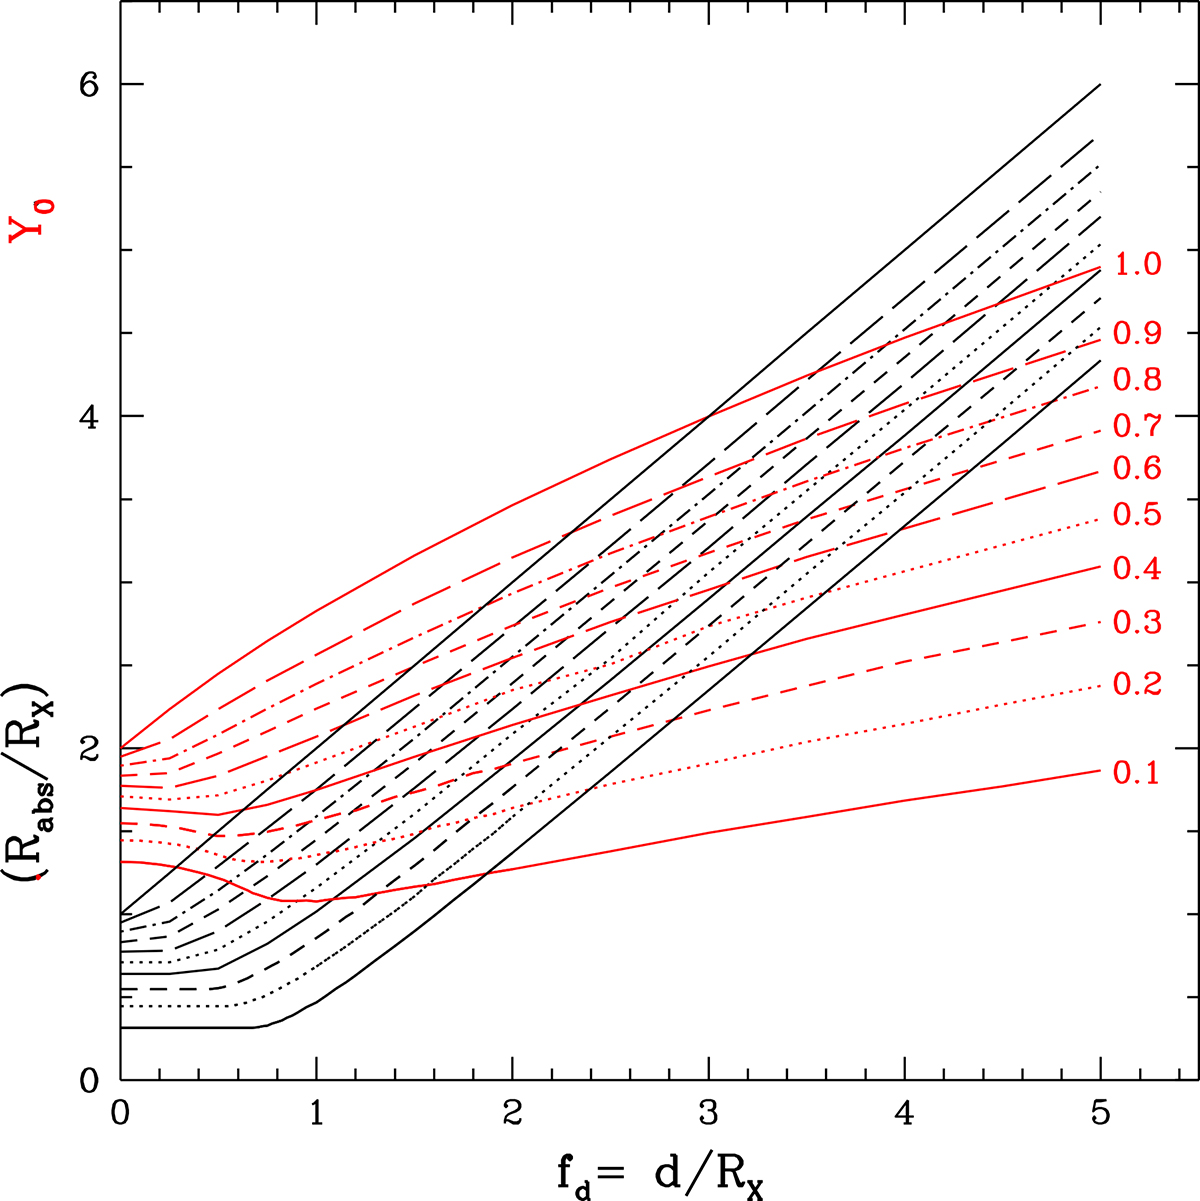
Black curves represent fabs as a function of the normalised impact parameter, fd, for a given value of CF. Red curves show Y0 (see Eq. 2) again as a function of fd and constant CF. Red curves are labelled with CF values; in the same order, increasing upwards, the same labels also apply to the black curves.
Current usage metrics show cumulative count of Article Views (full-text article views including HTML views, PDF and ePub downloads, according to the available data) and Abstracts Views on Vision4Press platform.
Data correspond to usage on the plateform after 2015. The current usage metrics is available 48-96 hours after online publication and is updated daily on week days.
Initial download of the metrics may take a while.